Join us for a webinar: The complexities of spatial multiomics unraveled
May 2
Page History
| Table of Contents | ||||||
|---|---|---|---|---|---|---|
|
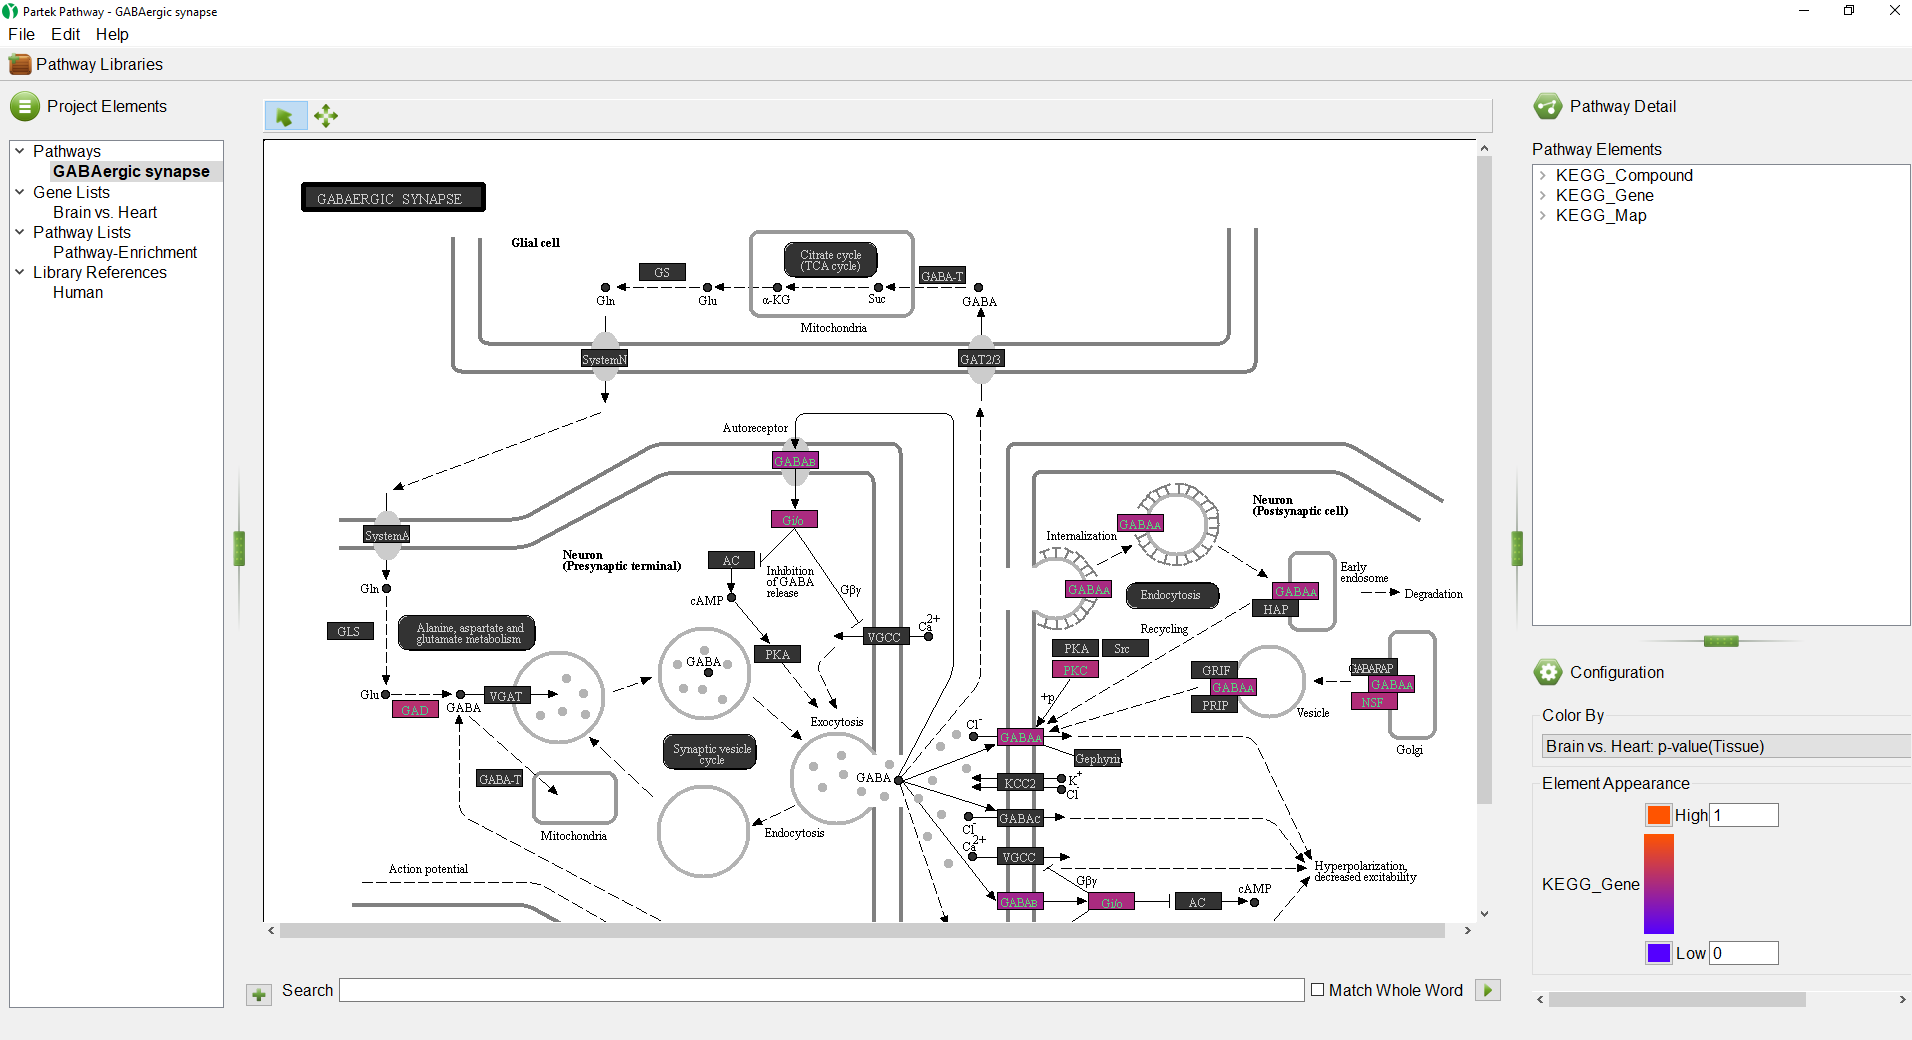
Partek Pathway is a separate program from Partek Genomics Suite with a distinct user interface (Figure 1).
| Numbered figure captions | ||||
|---|---|---|---|---|
| ||||
|
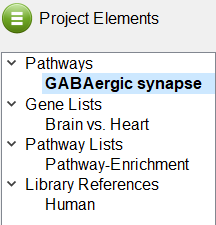
The Project Elements panel (Figure 2) displays the selected pathway, the original gene list, the Pathway Enrichment spreadsheet, and the library references that were used for the pathway analysis. The Project Elements panel is used to navigate between open pathway diagrams and spreadsheets.
| Numbered figure captions | ||||
|---|---|---|---|---|
| ||||
|
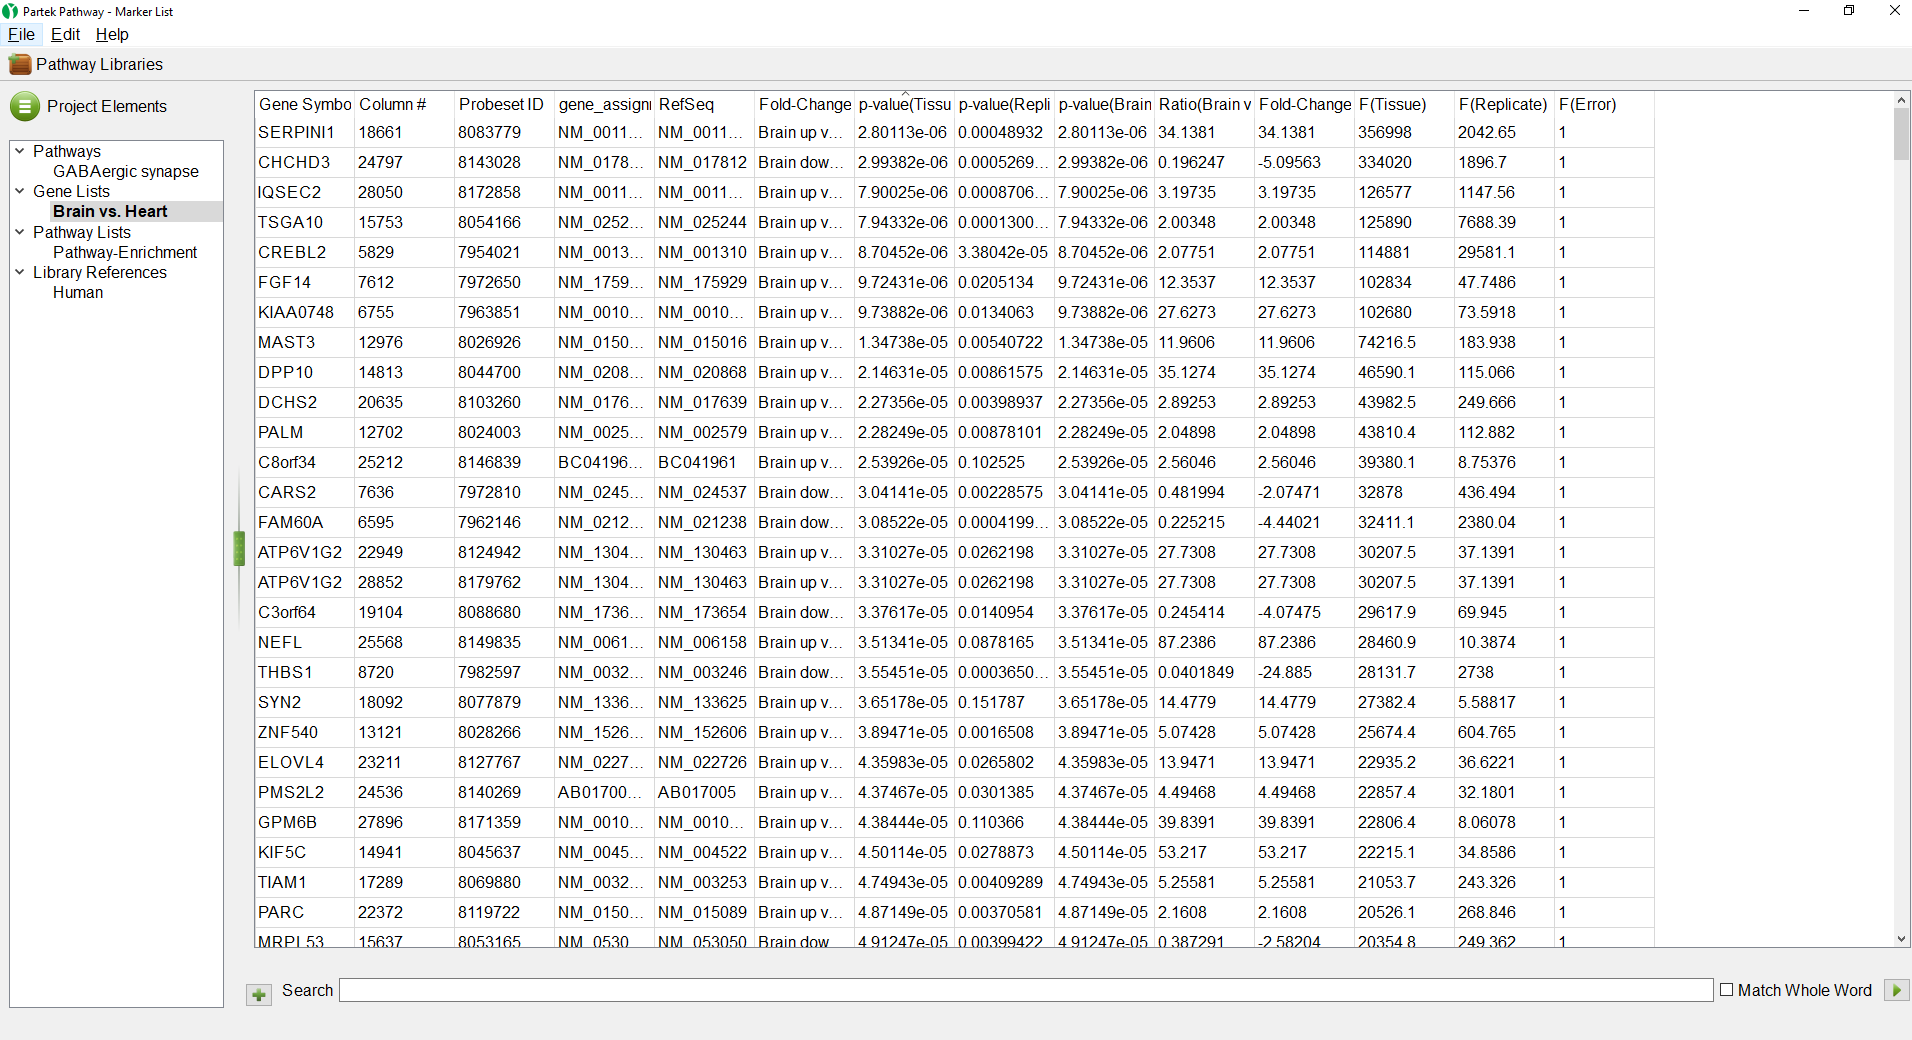
- Select the Brain vs. Heart spreadsheet under Gene Lists
The Brain vs. Heart gene list we created earlier will open (Figure 3). The spreadsheet can be sorted by any column by left-clicking a column header; the first click will sort by ascending values, the second click will switch to descending values.
| Numbered figure captions | ||||
|---|---|---|---|---|
| ||||
|
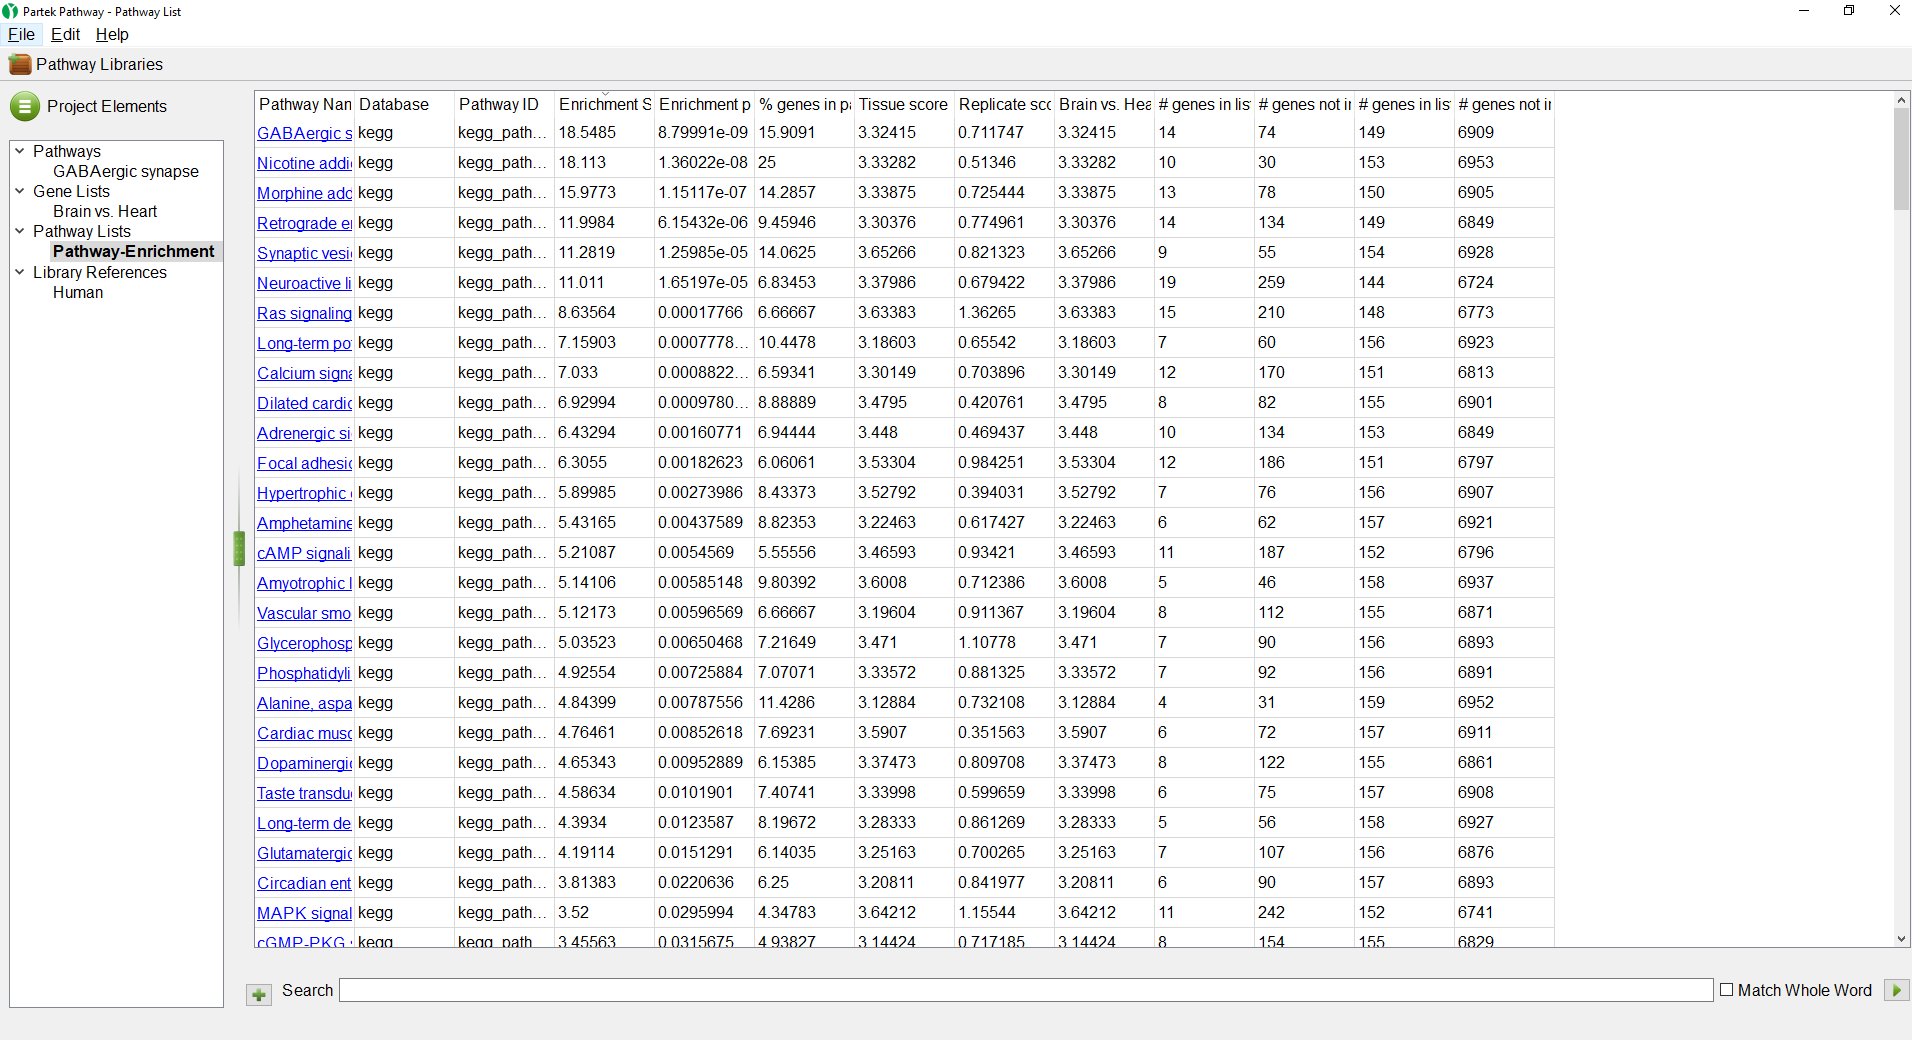
- Select the Pathway-Enrichment spreadsheet under Pathway Lists
The Pathway-Enrichment.txt spreadsheet also seen in Partek Genomics Suite will open (Figure 4). Selecting any of the pathway names will open its pathway diagram. The spreadsheet can be sorted by any column.
| Numbered figure captions | ||||
|---|---|---|---|---|
| ||||
|
- Select the GABAergic synapse pathway on the Pathway-Enrichment spreadsheet or the Project Elements panel
The GABAergic synapse pathway diagram will open. Genes in the pathway are shown as boxes. The color of the box is set by the Configuration panel (Figure 5).
| Numbered figure captions | ||||
|---|---|---|---|---|
| ||||
|
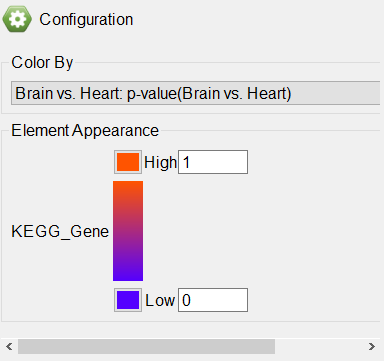
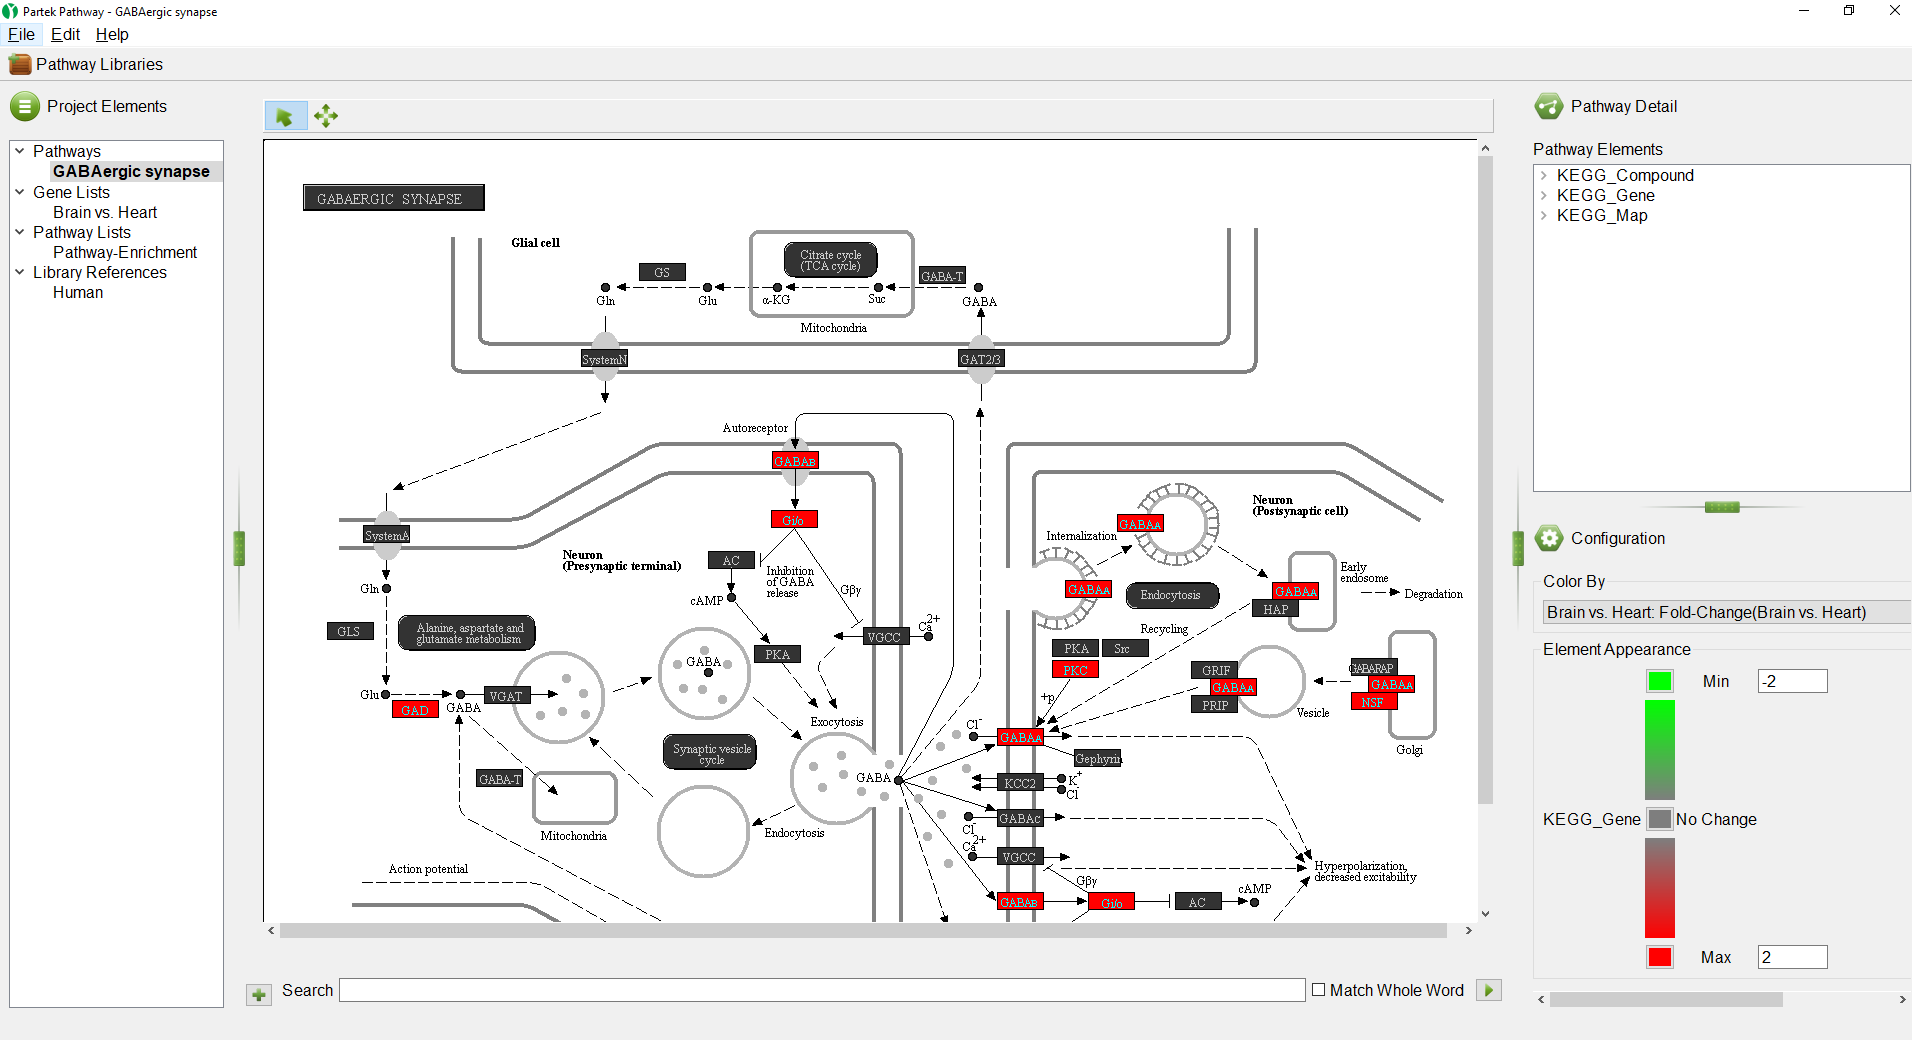
Any numerical column from the source gene list can be used to color the gene boxes. While significant p-values indicate a difference between the categories, they give no information about upregulation or downregulation of the pathway. We can overlay fold-change information on the pathway diagram.
- Select Brain vs. Heart: Fold-Change(Brain vs. Heart) from the drop-down menu
The pathway diagram now shows fold change for each gene in the pathway included in the gene list (Figure 6). Genes not in the gene list remain black.
| Numbered figure captions | ||||
|---|---|---|---|---|
| ||||
|
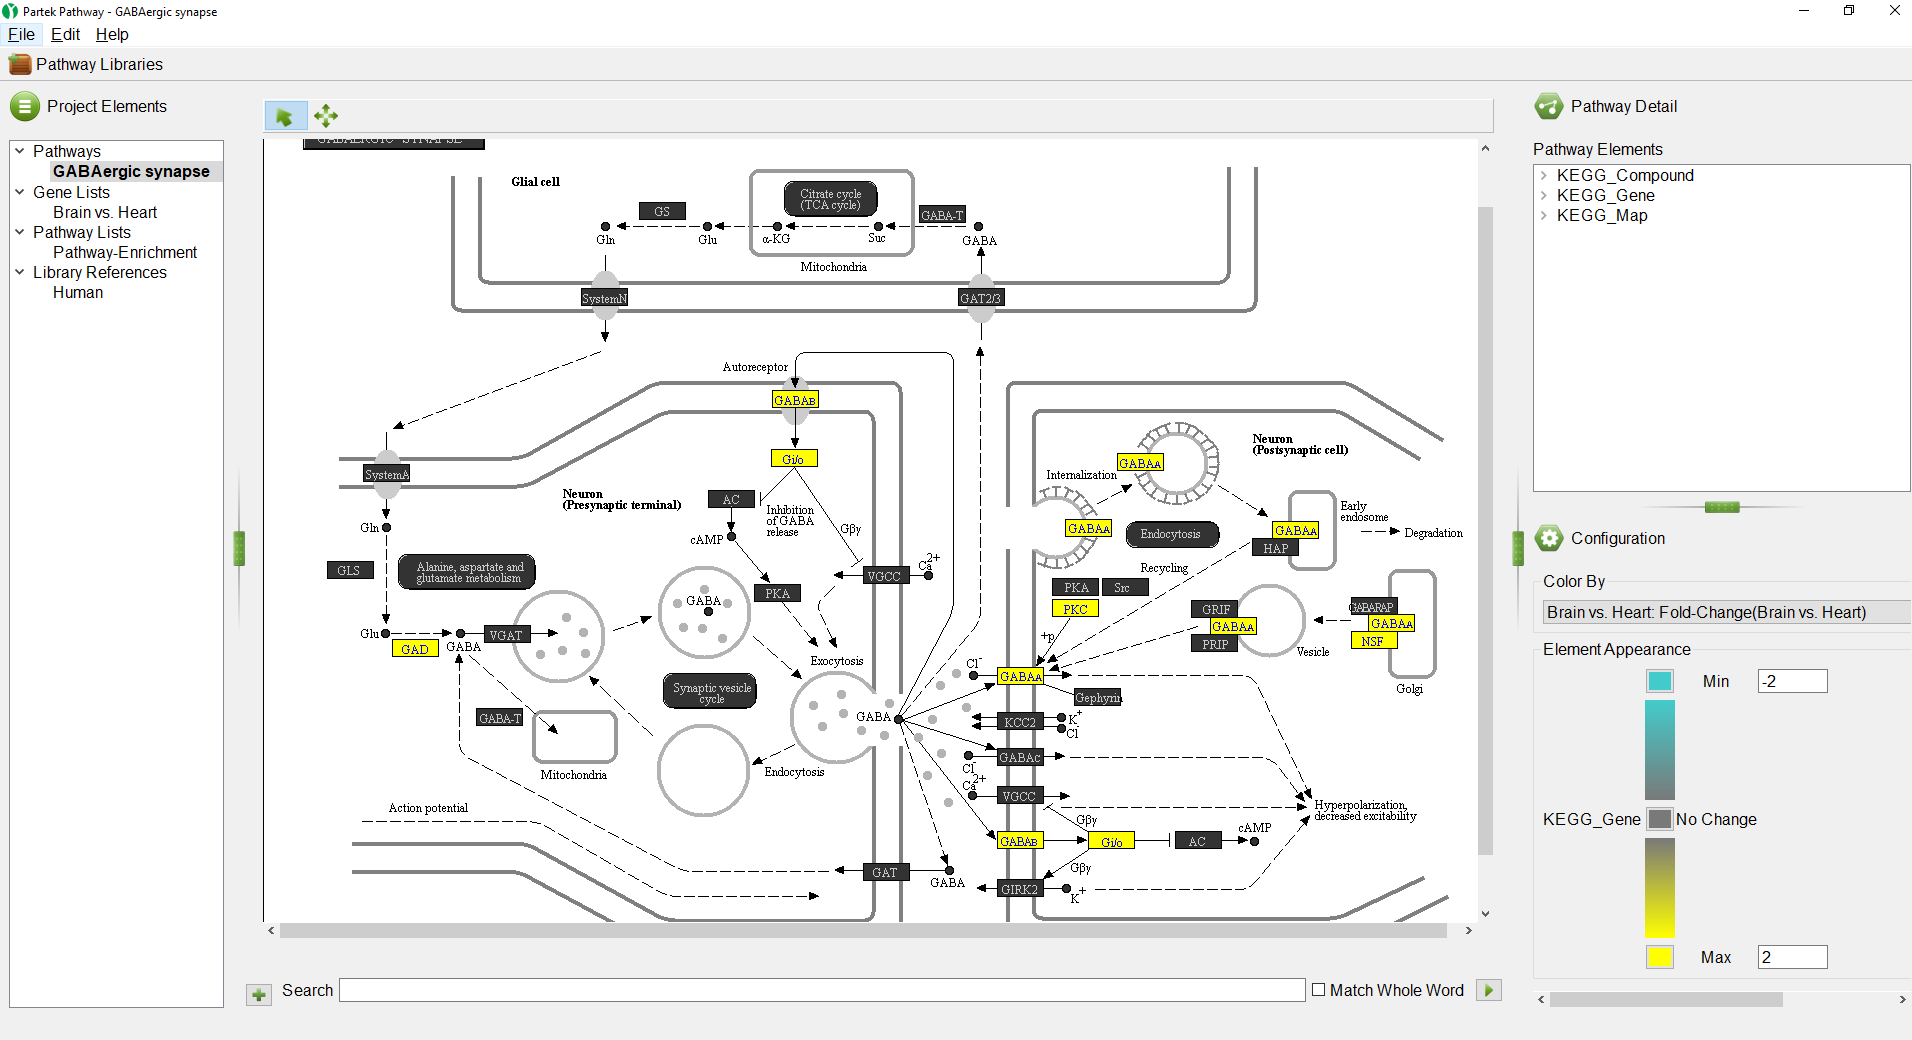
The colors and range of can be changed using the Color By panel.
- Select the red color square next to Max
- Select a yellow from the color picker interface
- Select the green color squre next to Min
- Select teal from the color picker interface
We can see that all the colored genes in the GABAergic synapse pathway are yellow (Figure 7), indicating that they are upregulated.
| Numbered figure captions | ||||
|---|---|---|---|---|
| ||||
|
We can select a gene to learn more.
- Select (
 ) to activate selection mode
 - Right-click GABAB (Figure 8)
| Numbered figure captions | ||||
|---|---|---|---|---|
| ||||
|
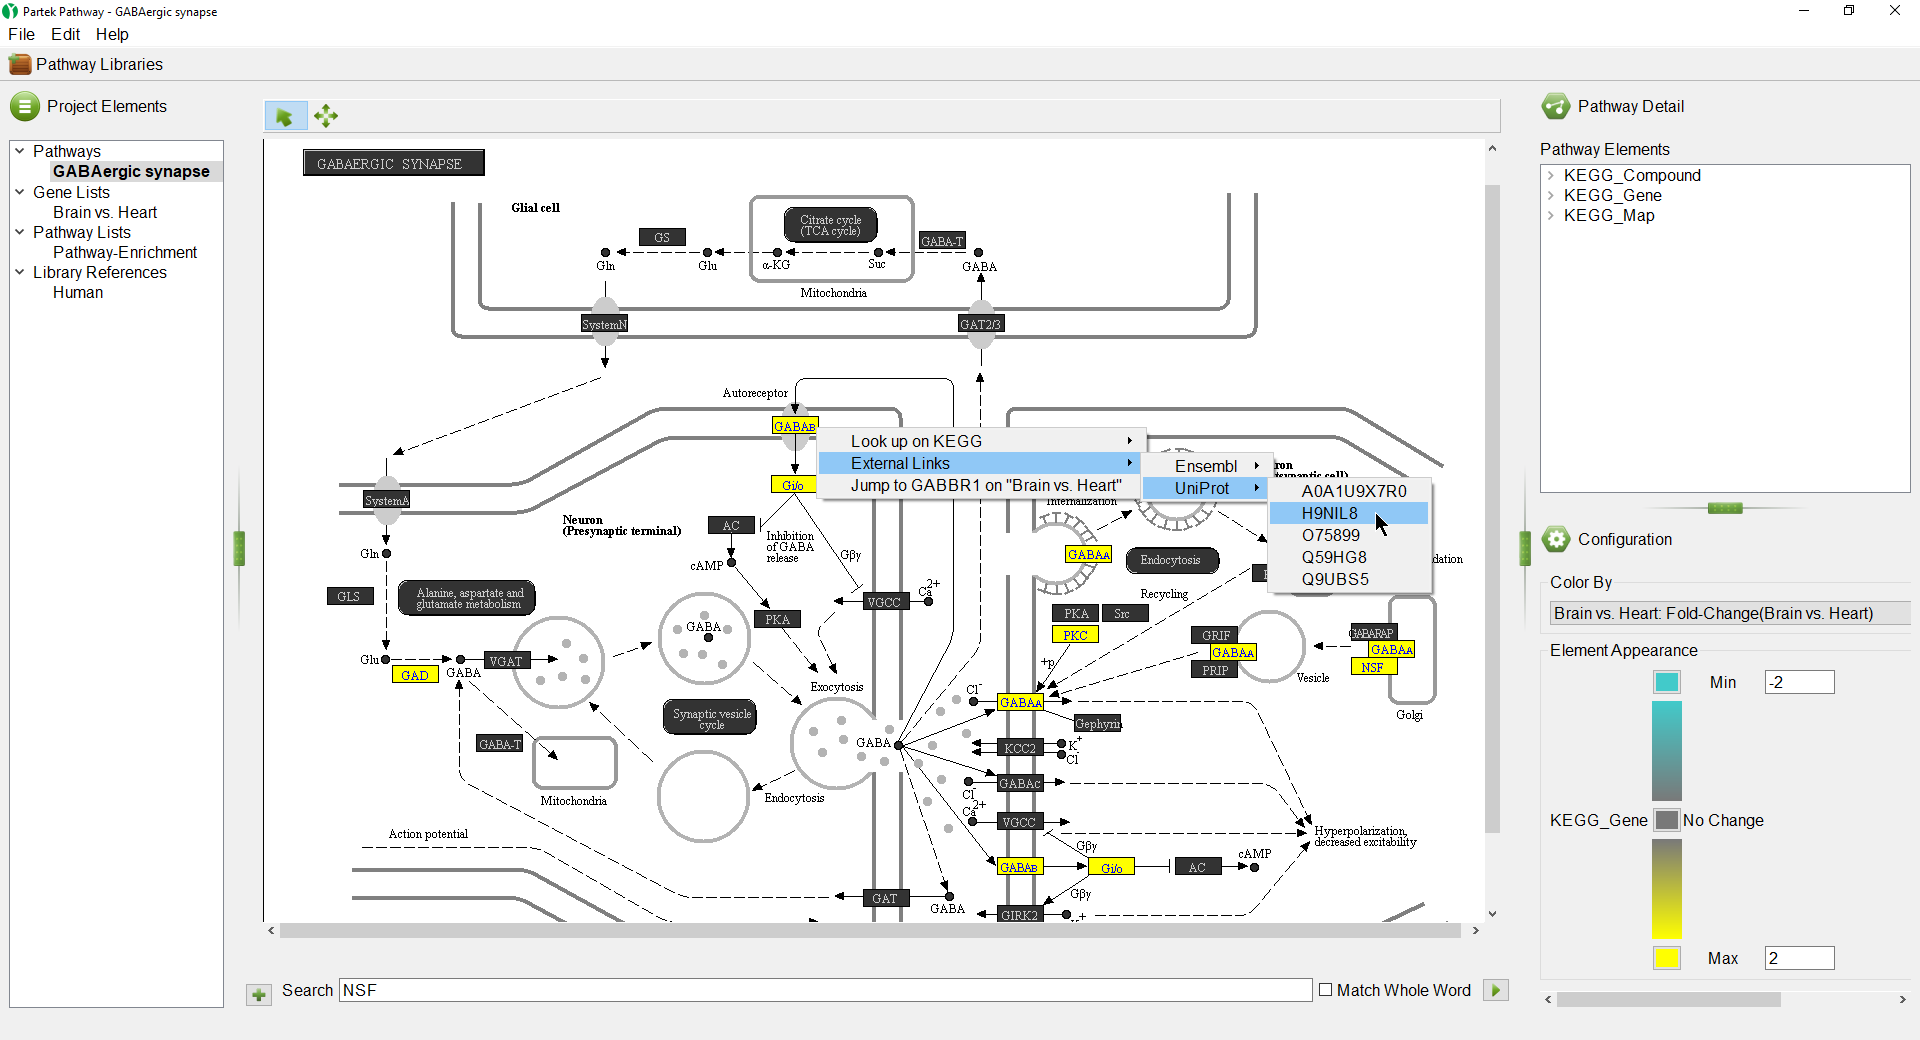
Opions available include:
Look up on KEGG - opens the KEGG page for the pathway on GenomeNet (genome.jp) in your web browser
Ensembl - under External Links, opens the page for the selected Ensembl ID on ensemble.org
UniProt - under External Links, opens the page for the selected UniProt ID on uniprot.org
Jump to ___ on "___" - opens the source gene list in Partek Pathway to the row of the selected gene
Selecting (![]() ) activates pan mode. This allows you to navigate around large pathway diagrams by left-clicking and dragging to move the view.
) activates pan mode. This allows you to navigate around large pathway diagrams by left-clicking and dragging to move the view.
The pathway database can be searched for genes of interest using the Search panel.
- Select (
 ) to open the search panel
 - Type NSF in the search box
- Select (
 ) to search
Pathways containing NSF appear on the right-hand side in the Search Results section in alphabetical order (Figure 9).
| Numbered figure captions | ||||
|---|---|---|---|---|
| ||||
|
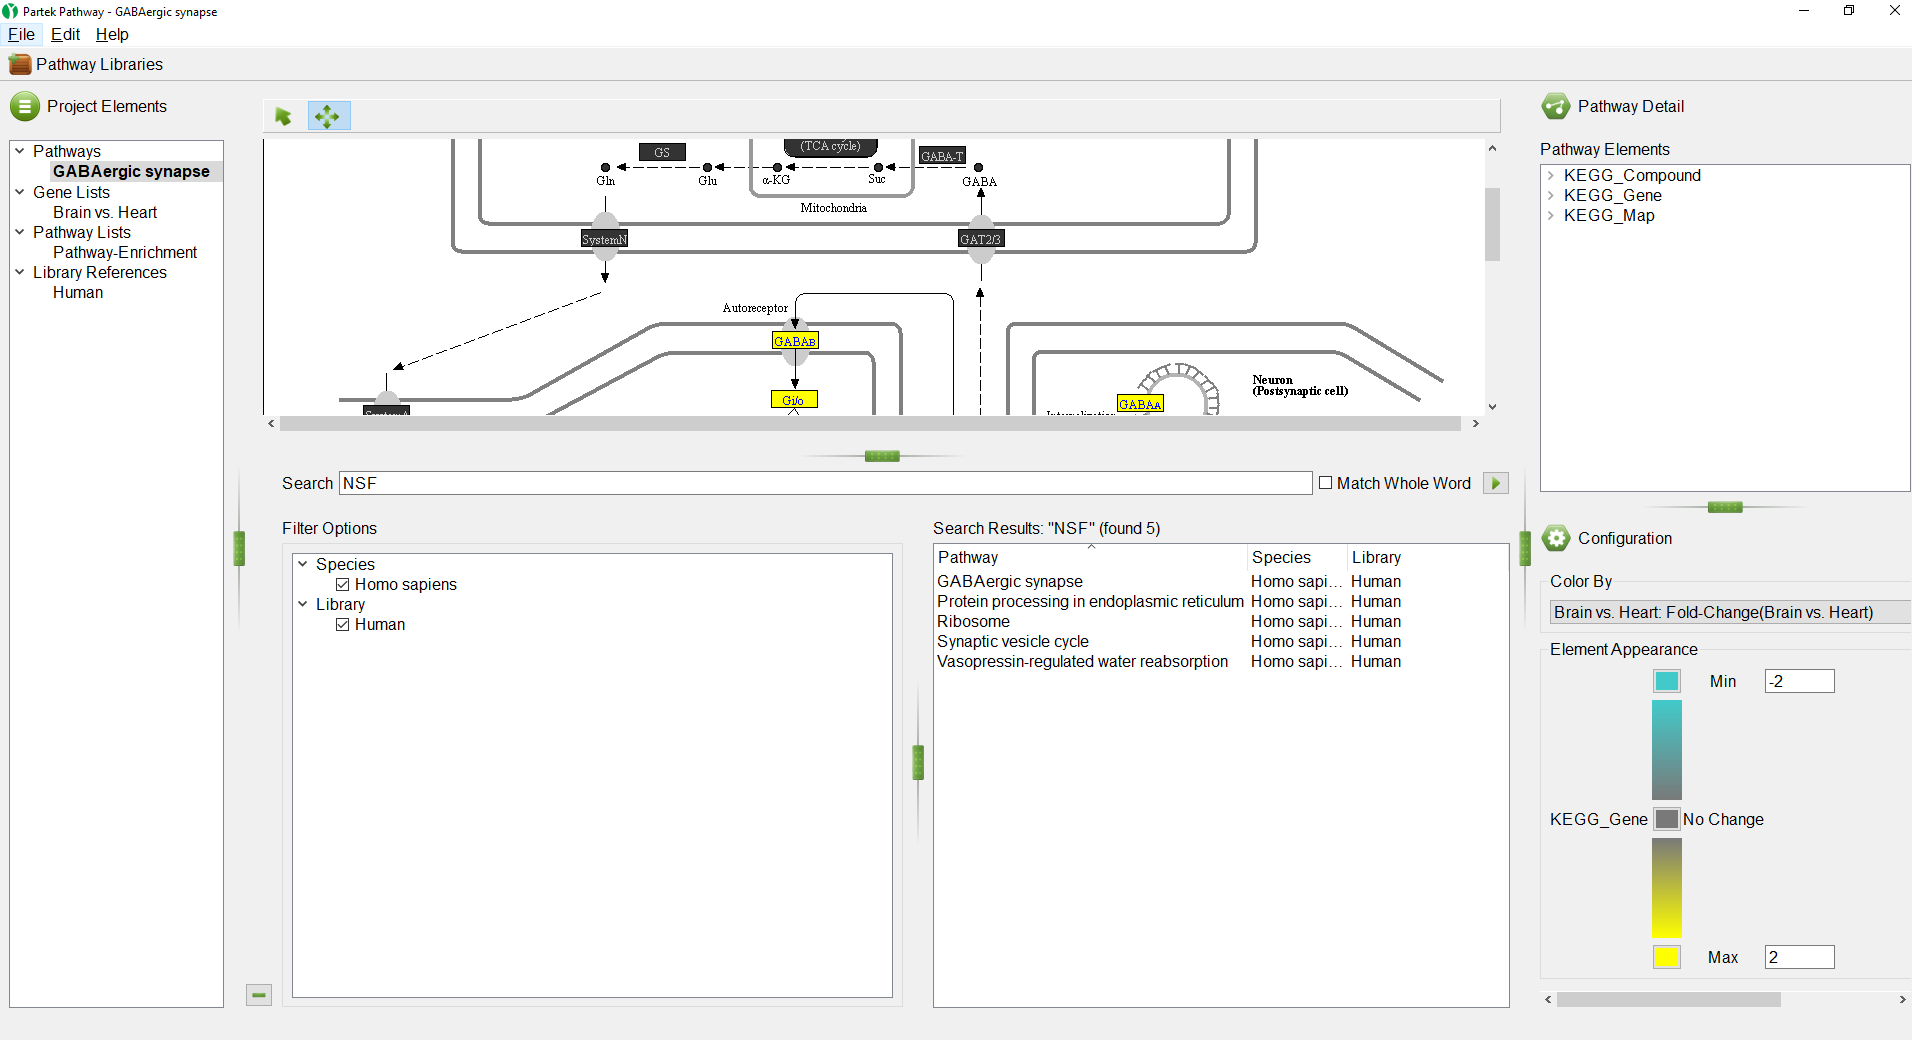
If multiple species or libraries have been loaded, the Filter Options section on the left-hand side can be used to choose which species and libraries to search.
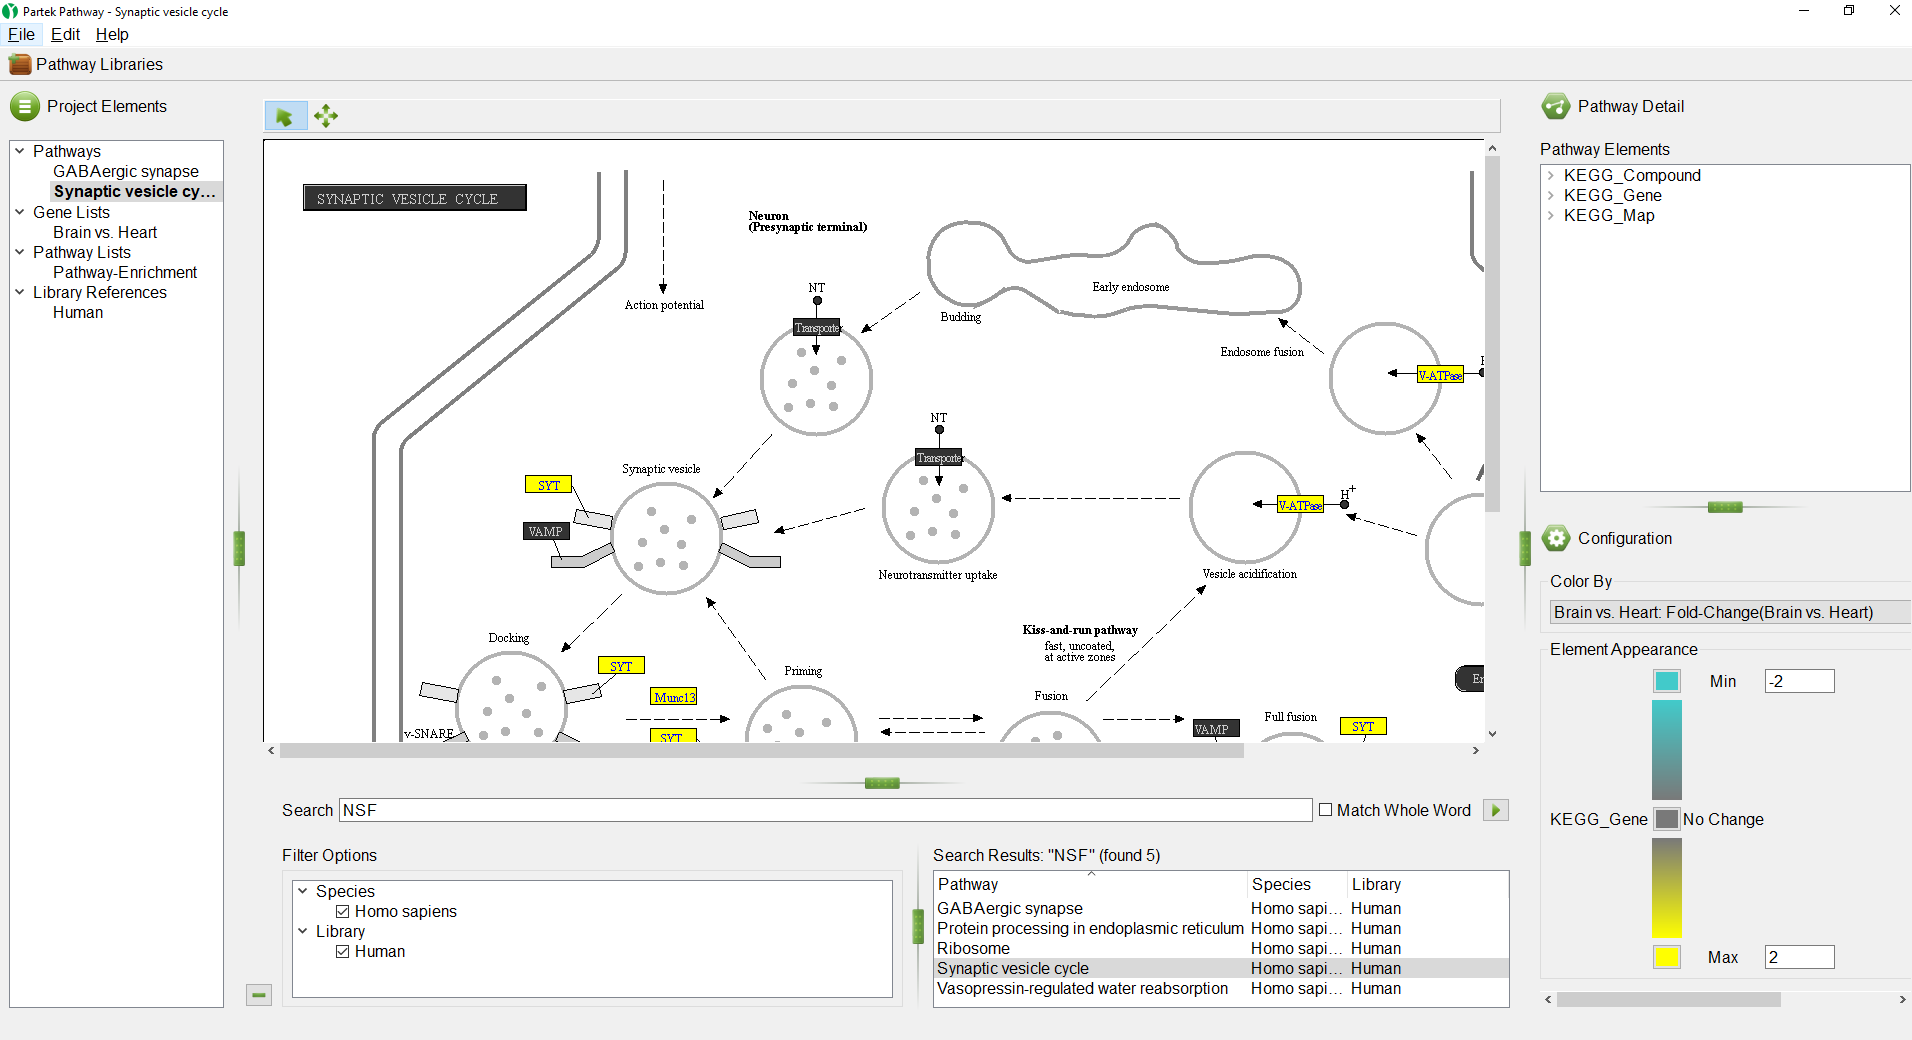
- Double click on Synaptic vesicle cycle in the Search Results section
The selected pathway, Synaptic vesicle cycle, will open in the Pathway Diagram panel (Figure 10).
- Select (
 ) to minimize the Search panel
| Numbered figure captions | ||||
|---|---|---|---|---|
| ||||
|
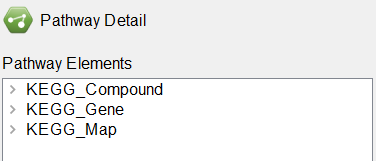
On the right-hand side of the Partek Pathway window, we see the Pathway Detail panel (Figure 11).
| Numbered figure captions | ||||
|---|---|---|---|---|
| ||||
|
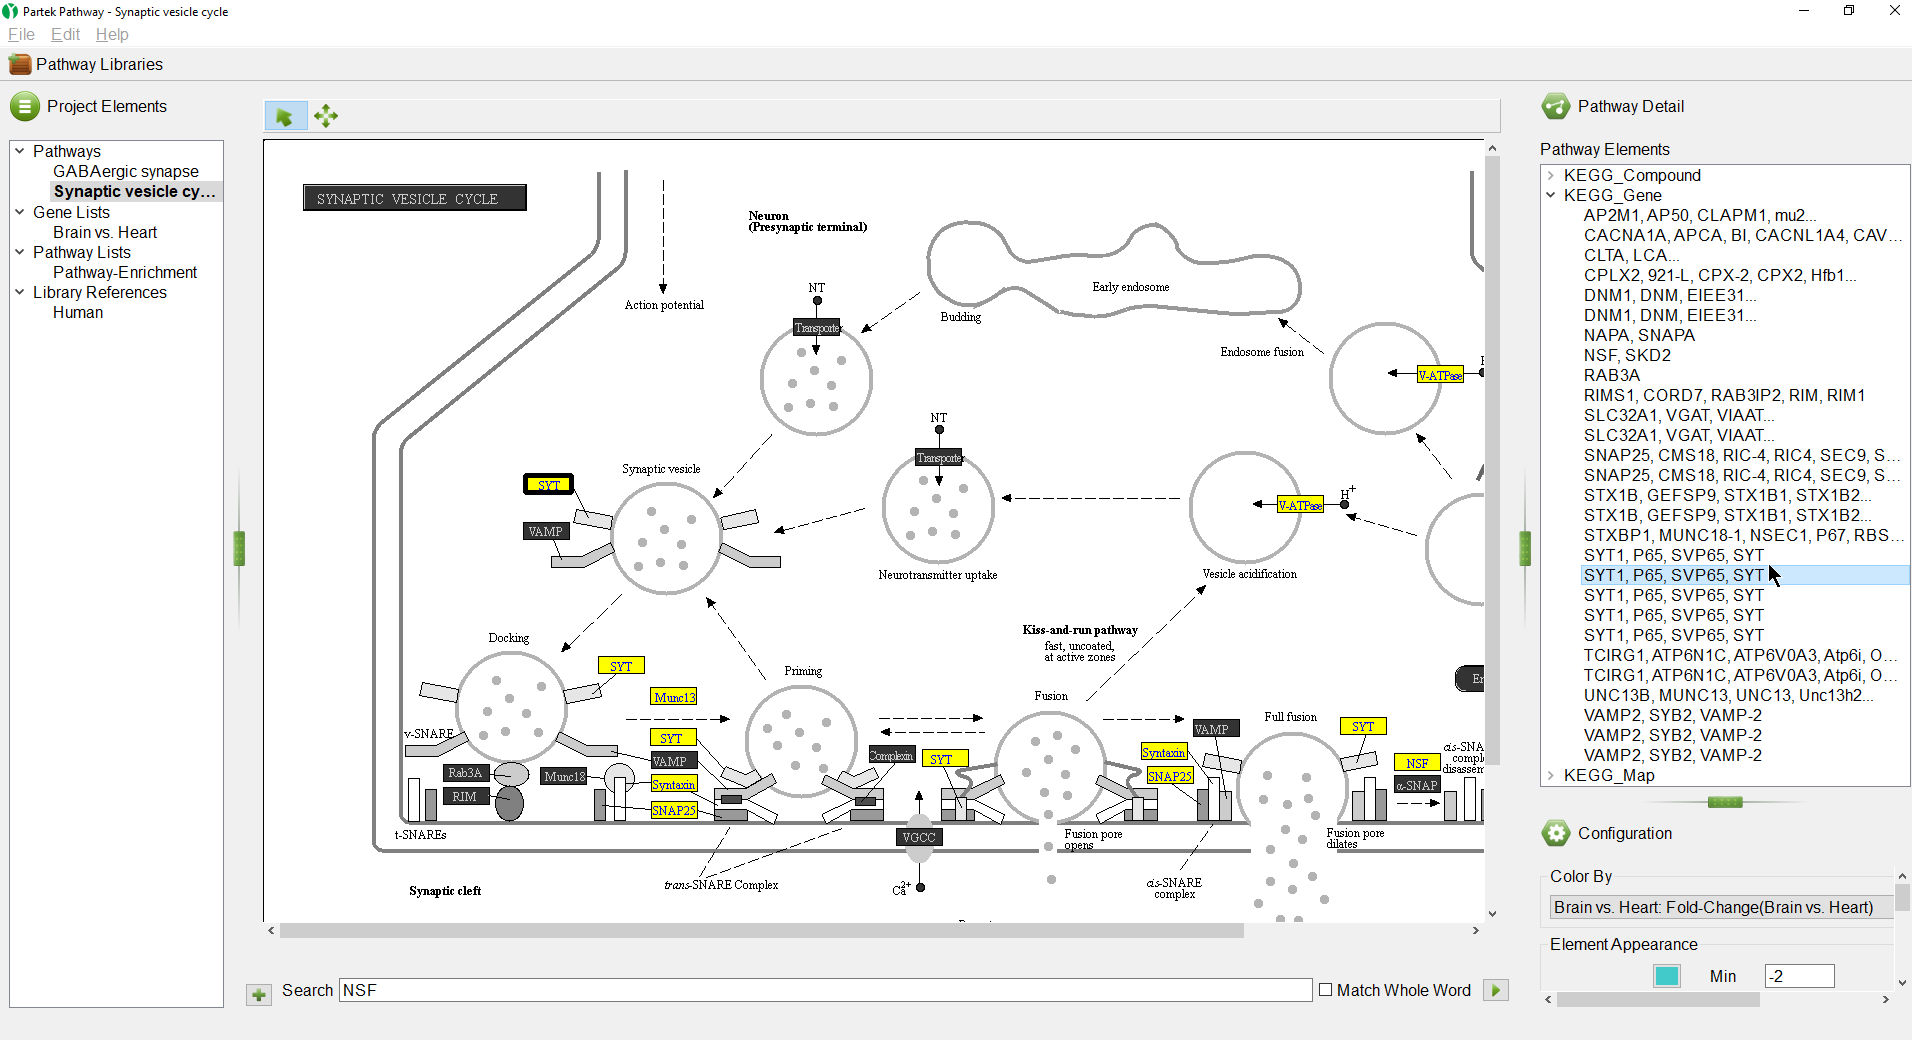
- Select KEGG_Gene to open the list of genes in the pathway
Selecting a gene in the list will highlight it in the pathway diagram (Figure 12).
| Numbered figure captions | ||||
|---|---|---|---|---|
| ||||
|
Another way to select and view a pathway is browsing the Pathway Libraries.
- Select (
 ) in the upper left-hand corner of the Partek Pathway window
The Pathway Libraries dialog will open (Figure 13).
| Numbered figure captions | ||||
|---|---|---|---|---|
| ||||
|
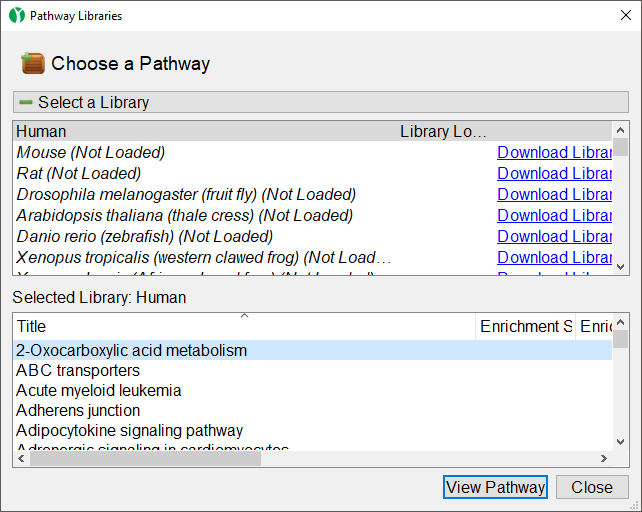
In the upper section of the dialog, you can view available KEGG libraries and download them by selecting the Download Library link. Selecting a pathway opens it in the lower section of the dialog.
In the lower section of the dialog, you can view a list of all pathways library selected in the upper panel. You can also open any pathway from the selected library in the Pathway Diagram panel.
- Select Adherens Junction
- Select View Pathway to open the pathway diagram
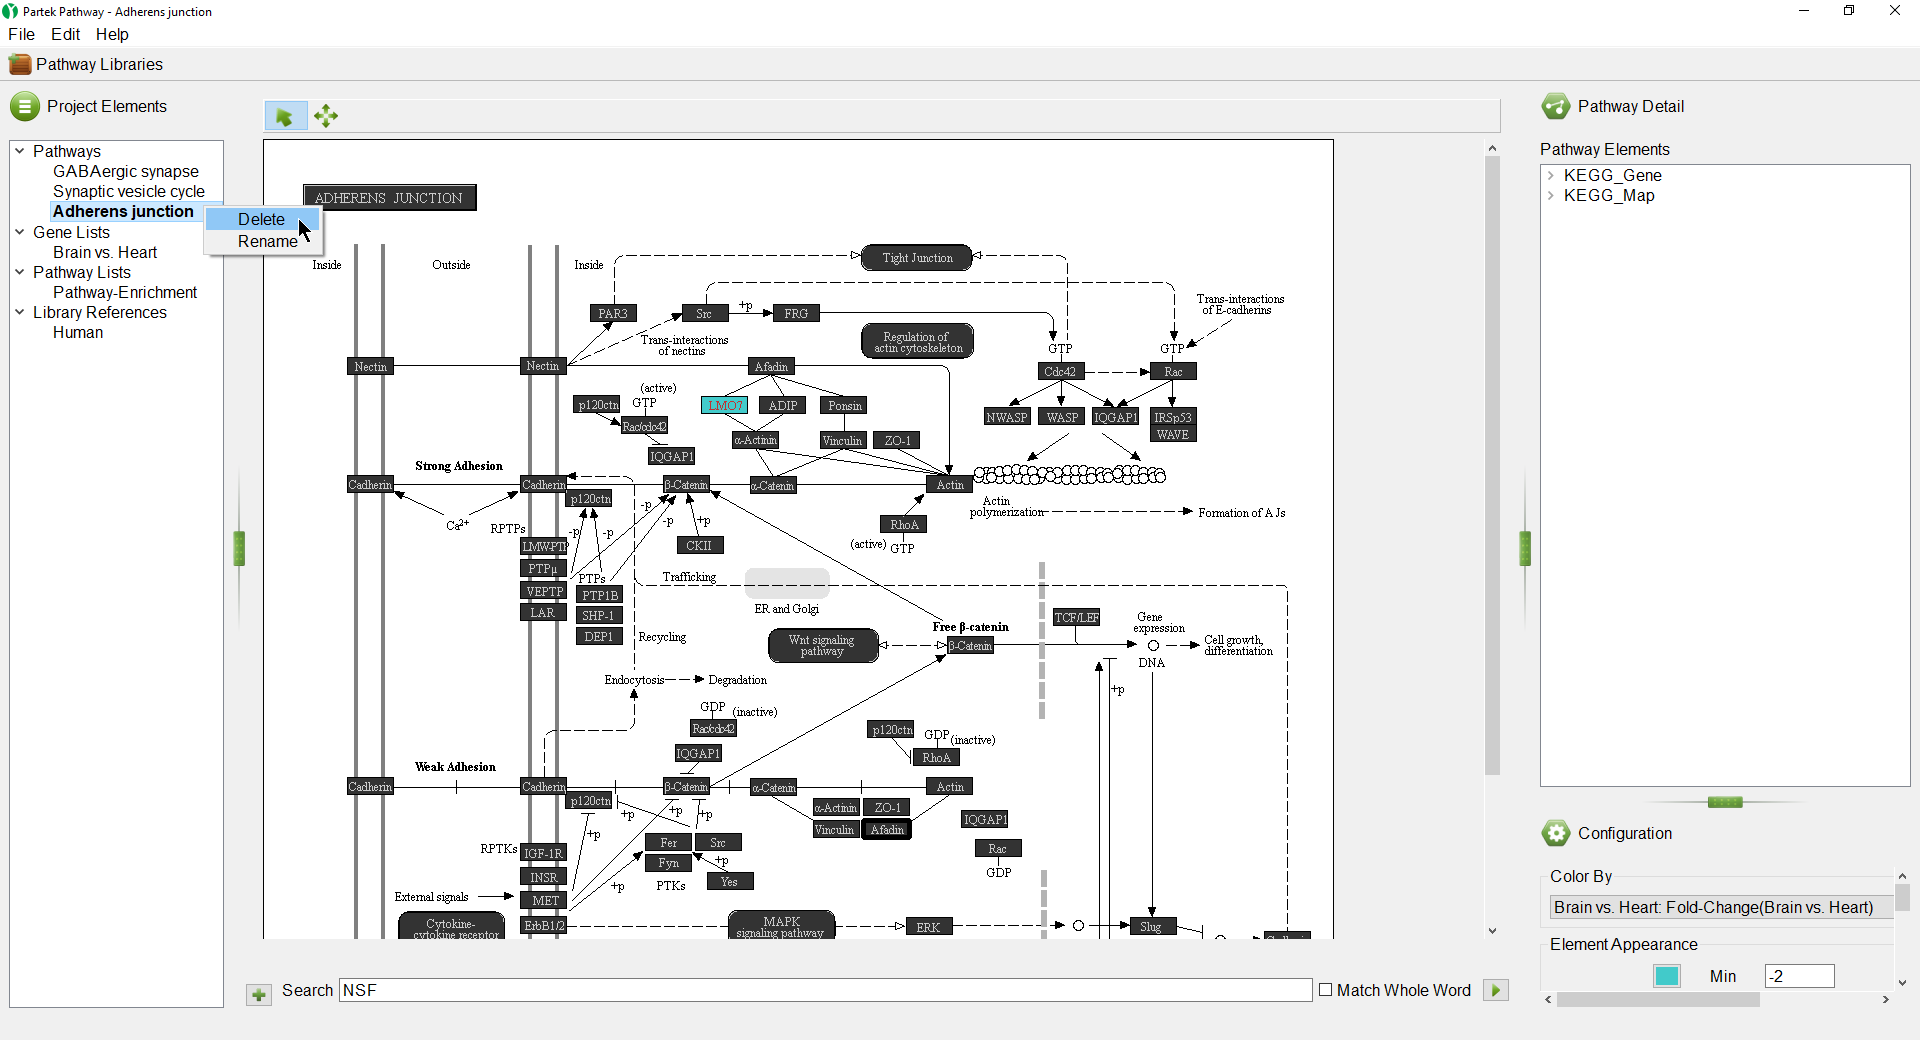
We can use the Project Elements panel to close an open pathway diagram or list.
- Right-click Adherens Junction in the Project Elements panel
- Select Delete from the pop-up menu to close the diagram (Figure 14)
| Numbered figure captions | ||||
|---|---|---|---|---|
| ||||
|
The Search panel and Pathway Libraries can also be used to open pathway diagrams for pathways without any open gene or pathway lists.
| Additional assistance |
|---|
| Rate Macro | ||
|---|---|---|
|
Overview
Content Tools