Page History
...
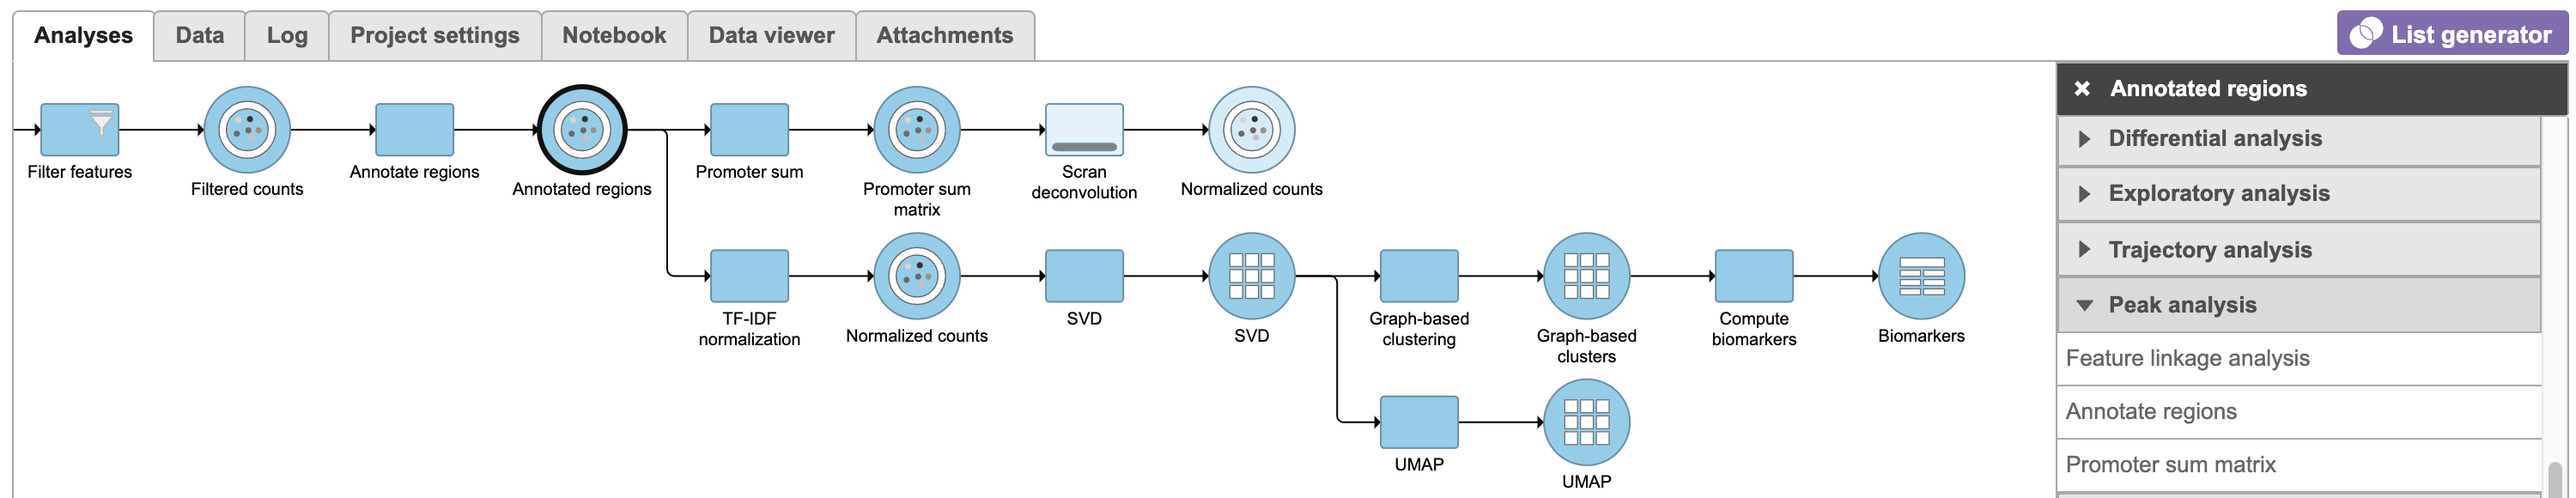
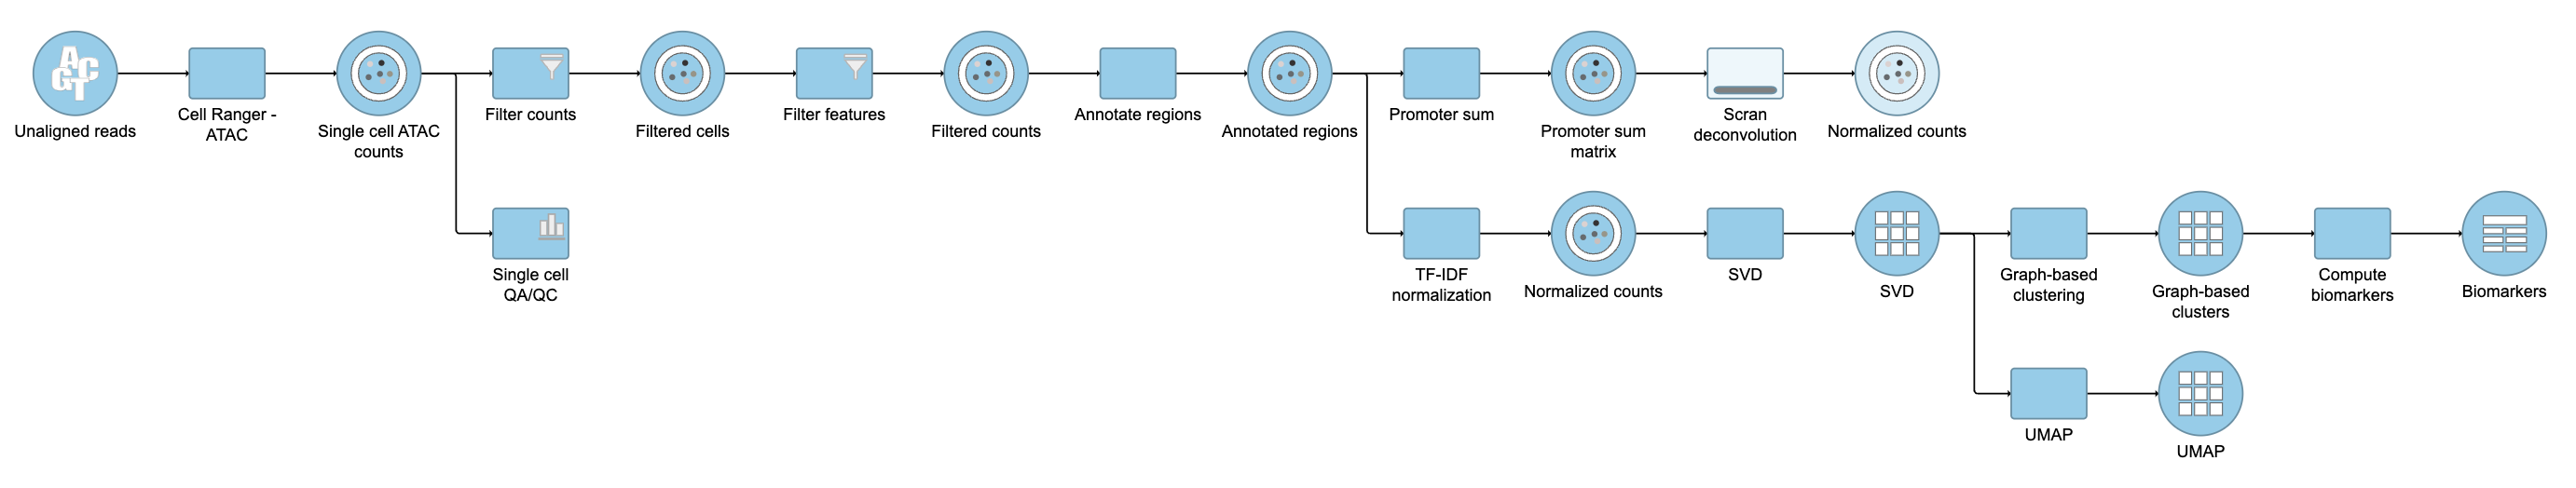
The input for Annotate peaks is a Peaks type data node.
- Click a Peaks the Filtered features data node
- Click the Peak analysis section in the toolbox
- Click Annotate regions
- Set the Genomic overlaps parameter
...
| Numbered figure captions | ||||
|---|---|---|---|---|
| ||||
|
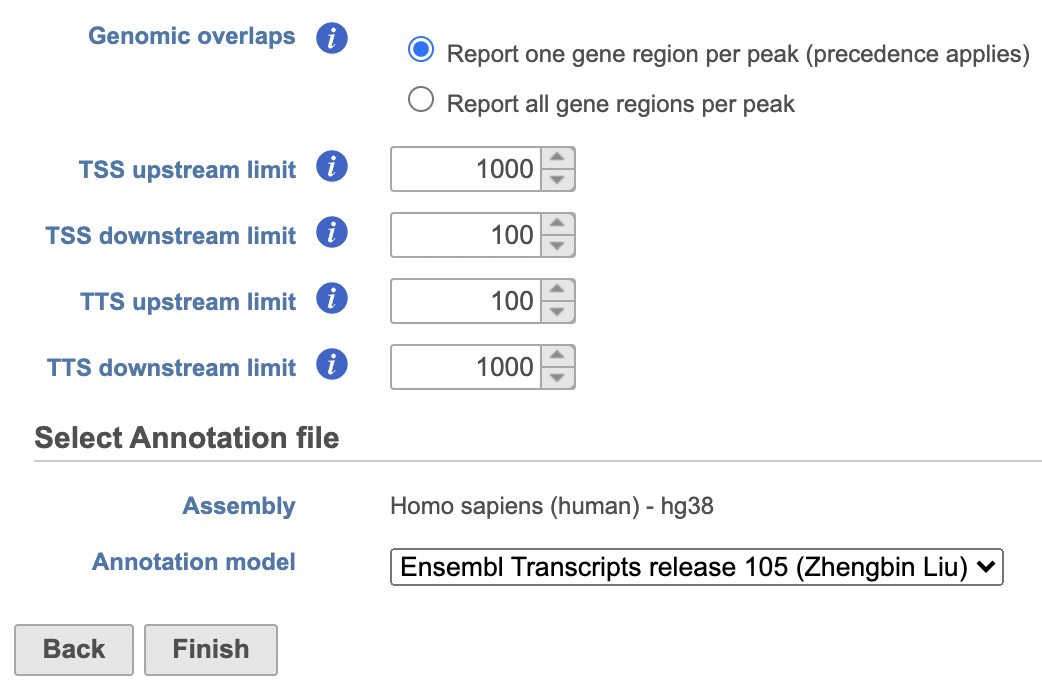
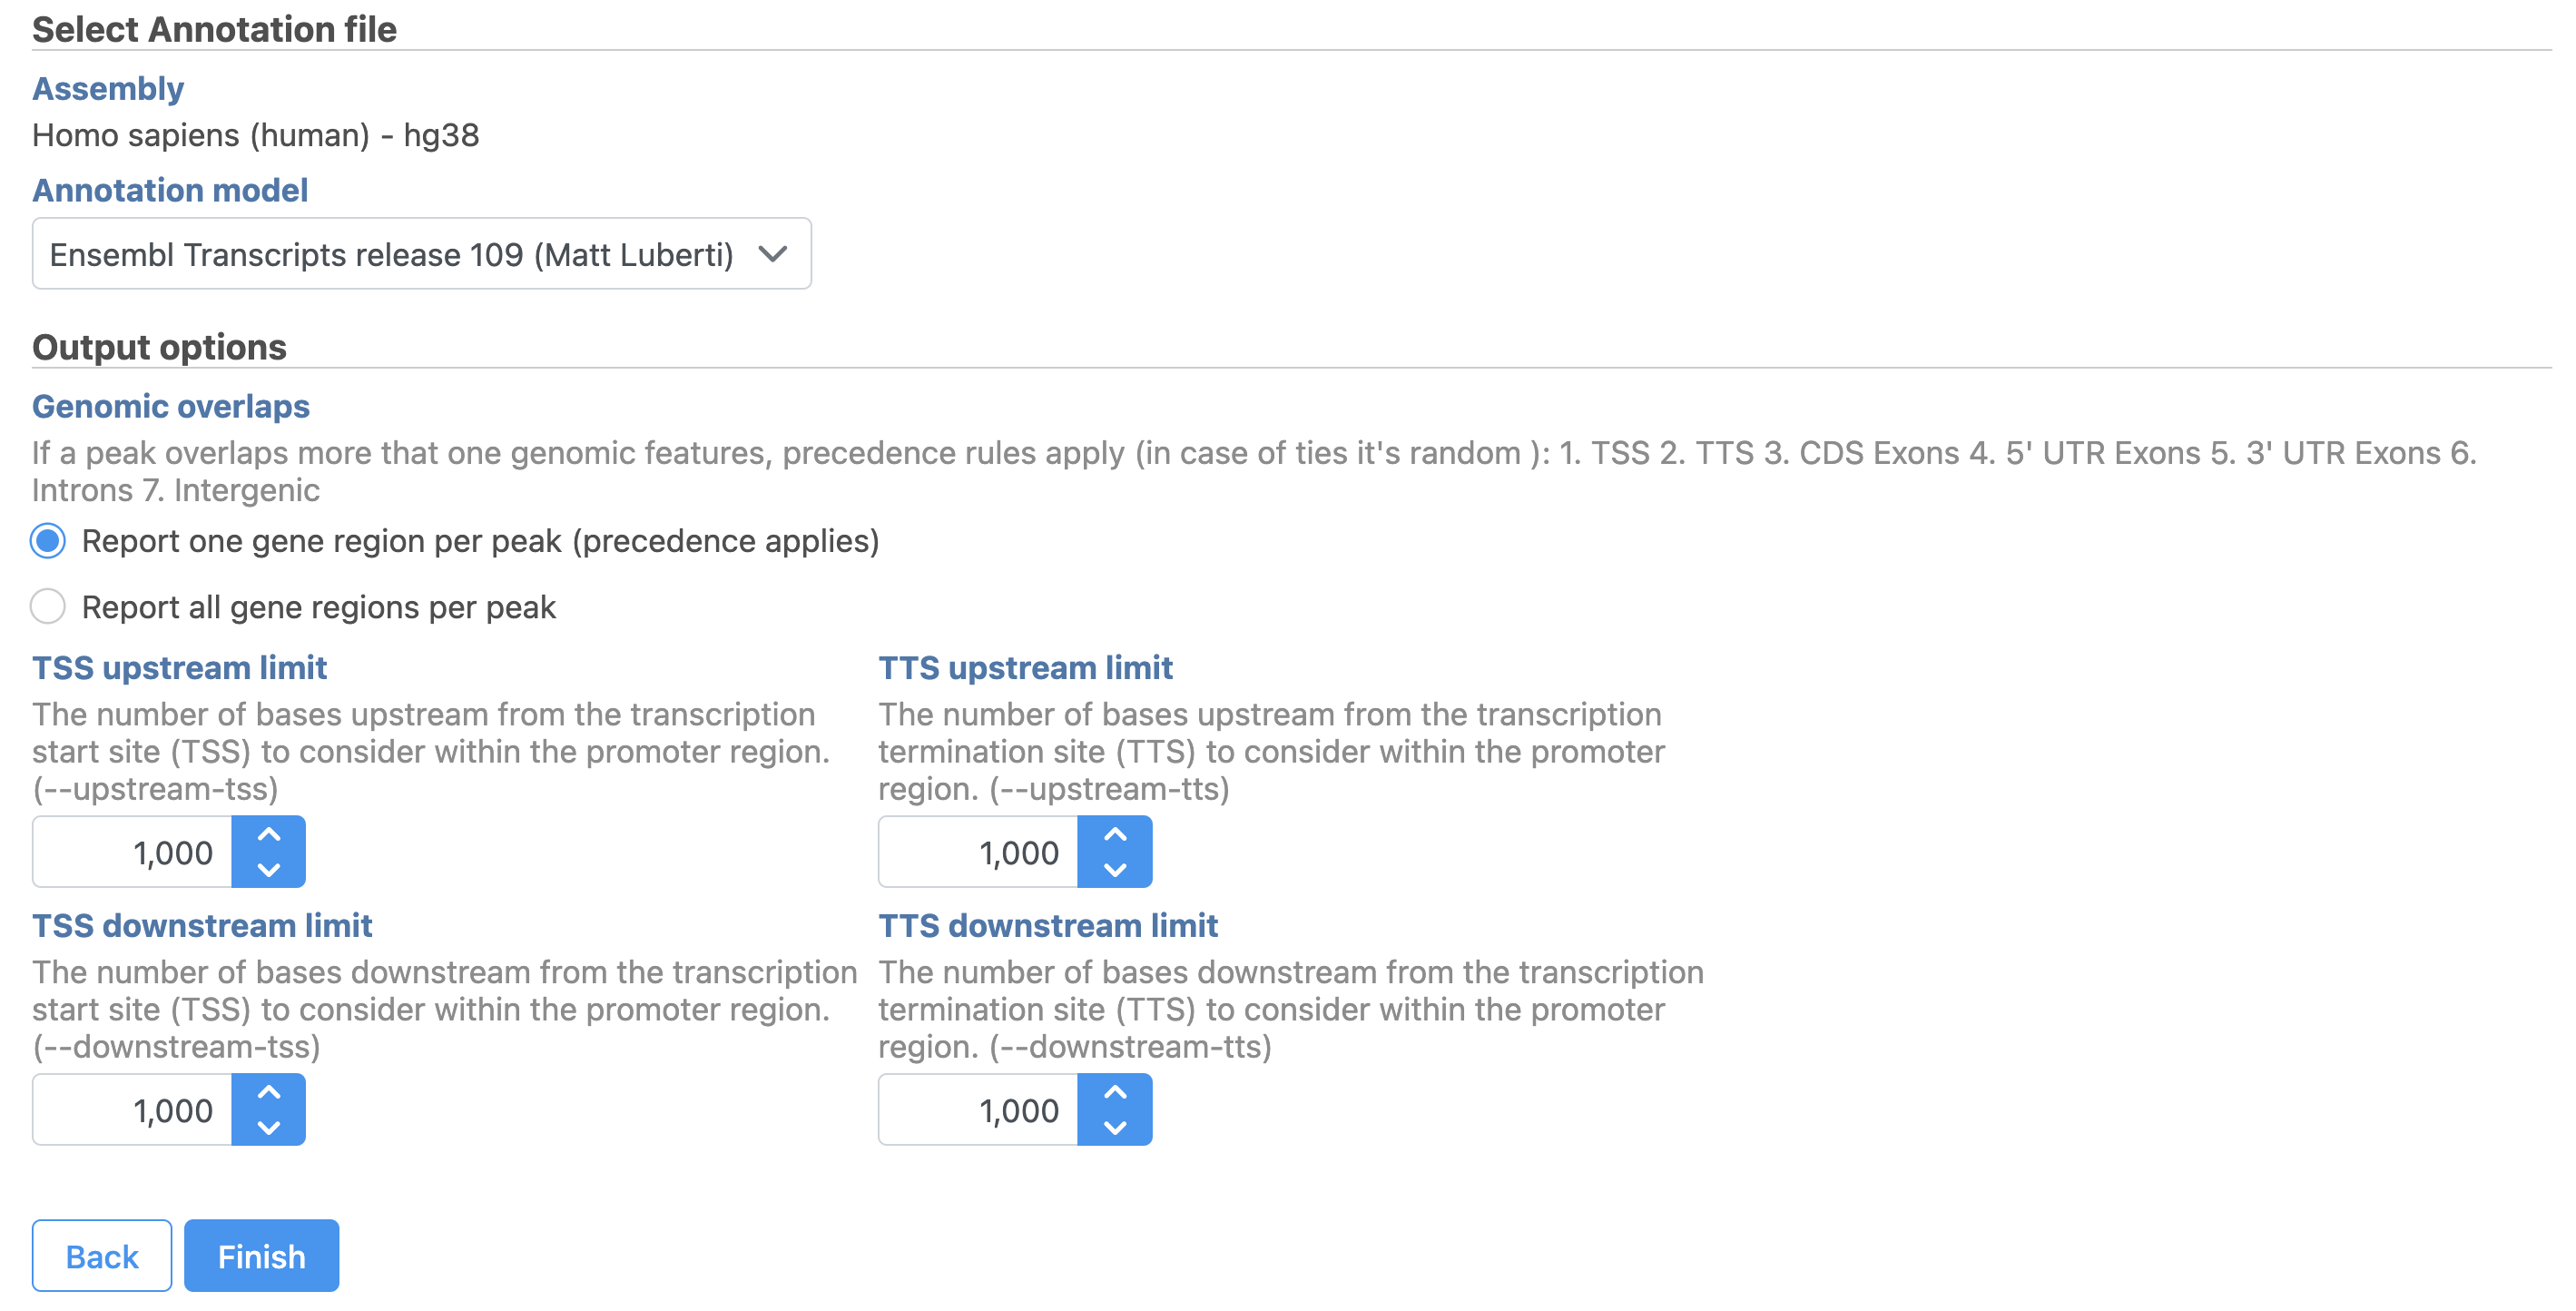
Users are able to define the transcription start site (TSS) and transcription termination site (TTS) limit in the unit of bp.
...
| Numbered figure captions | ||||
|---|---|---|---|---|
| ||||
|
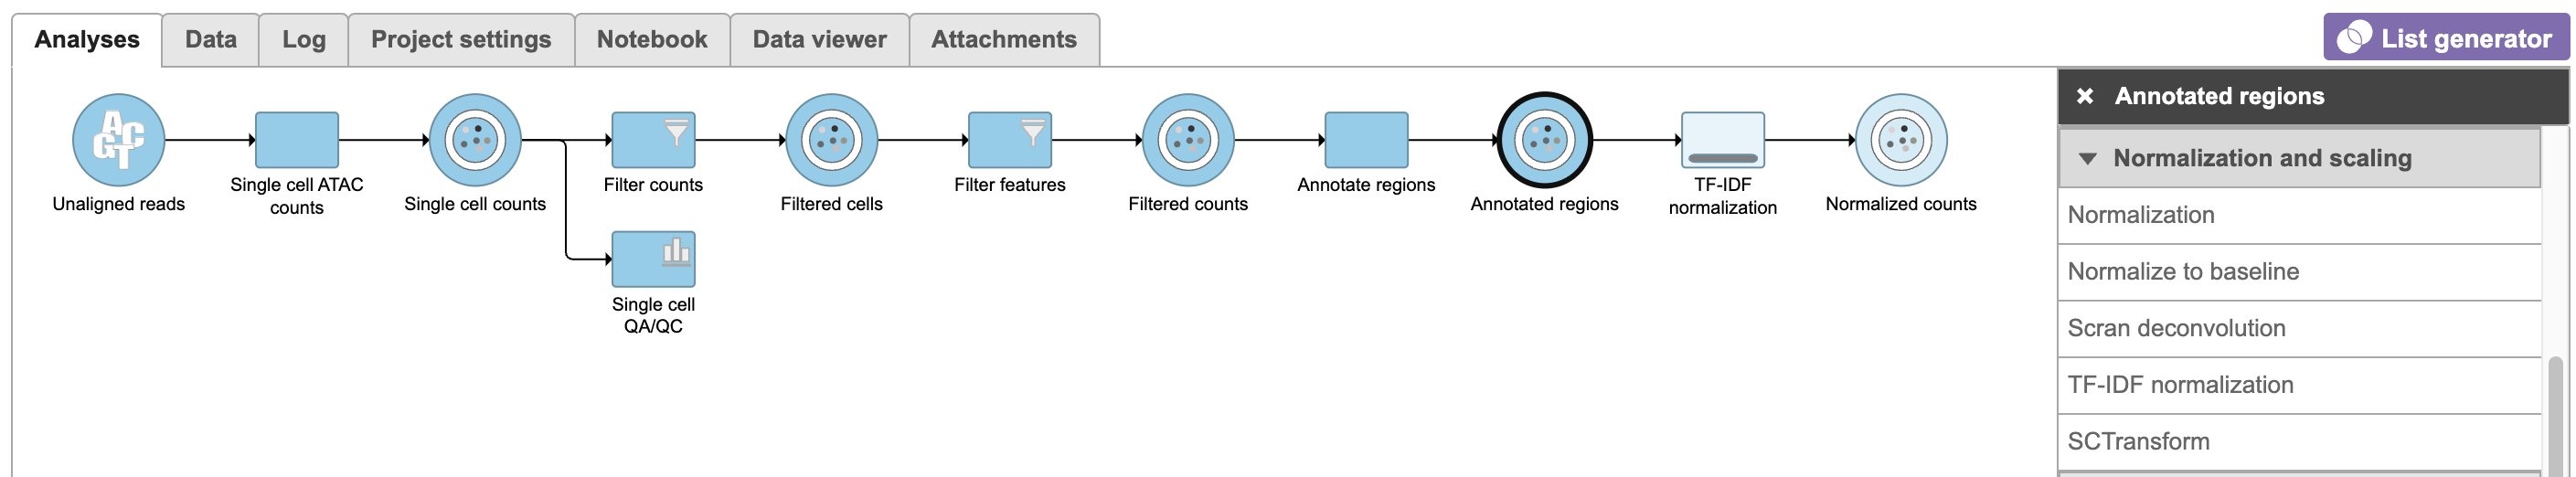
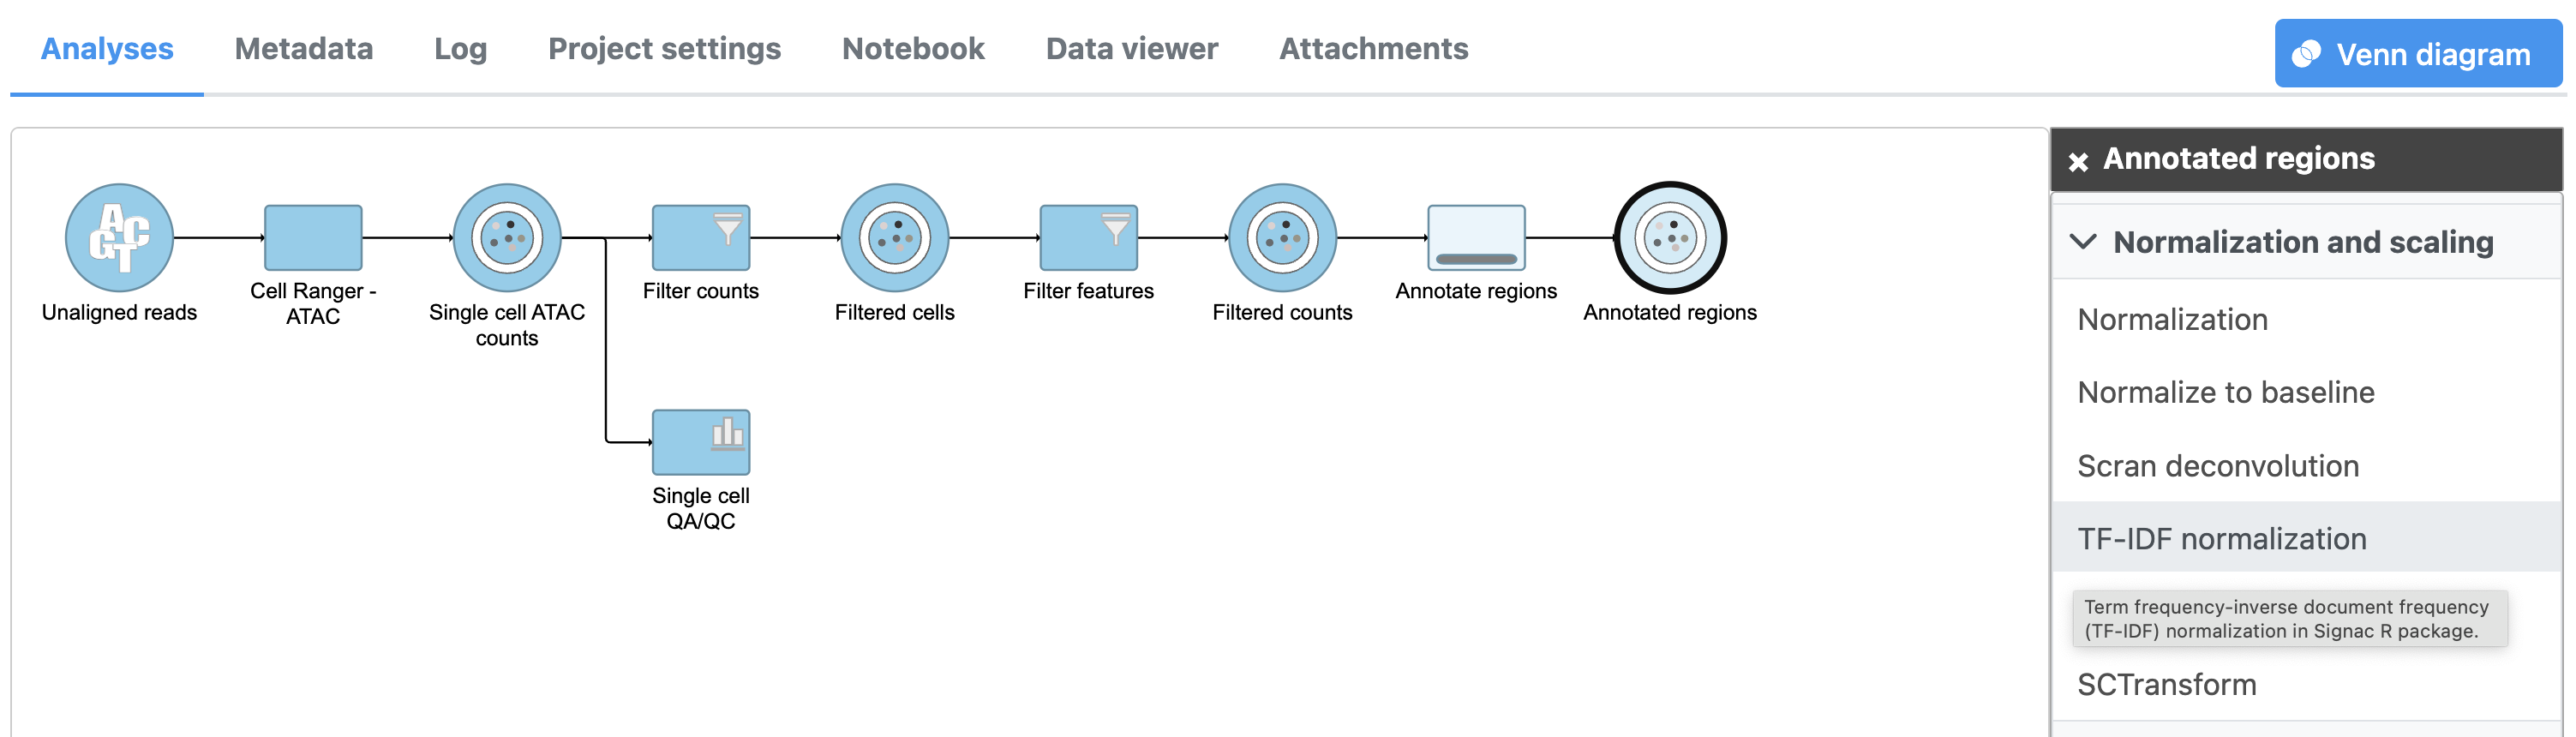
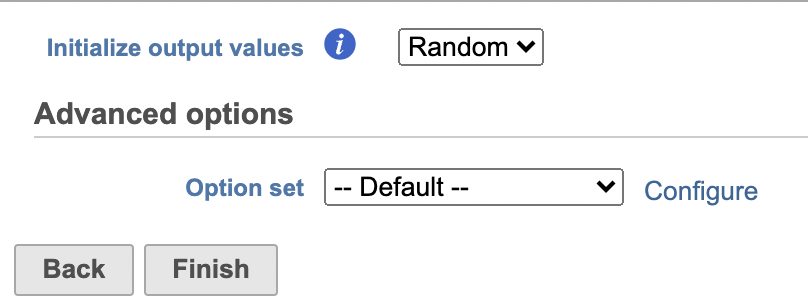
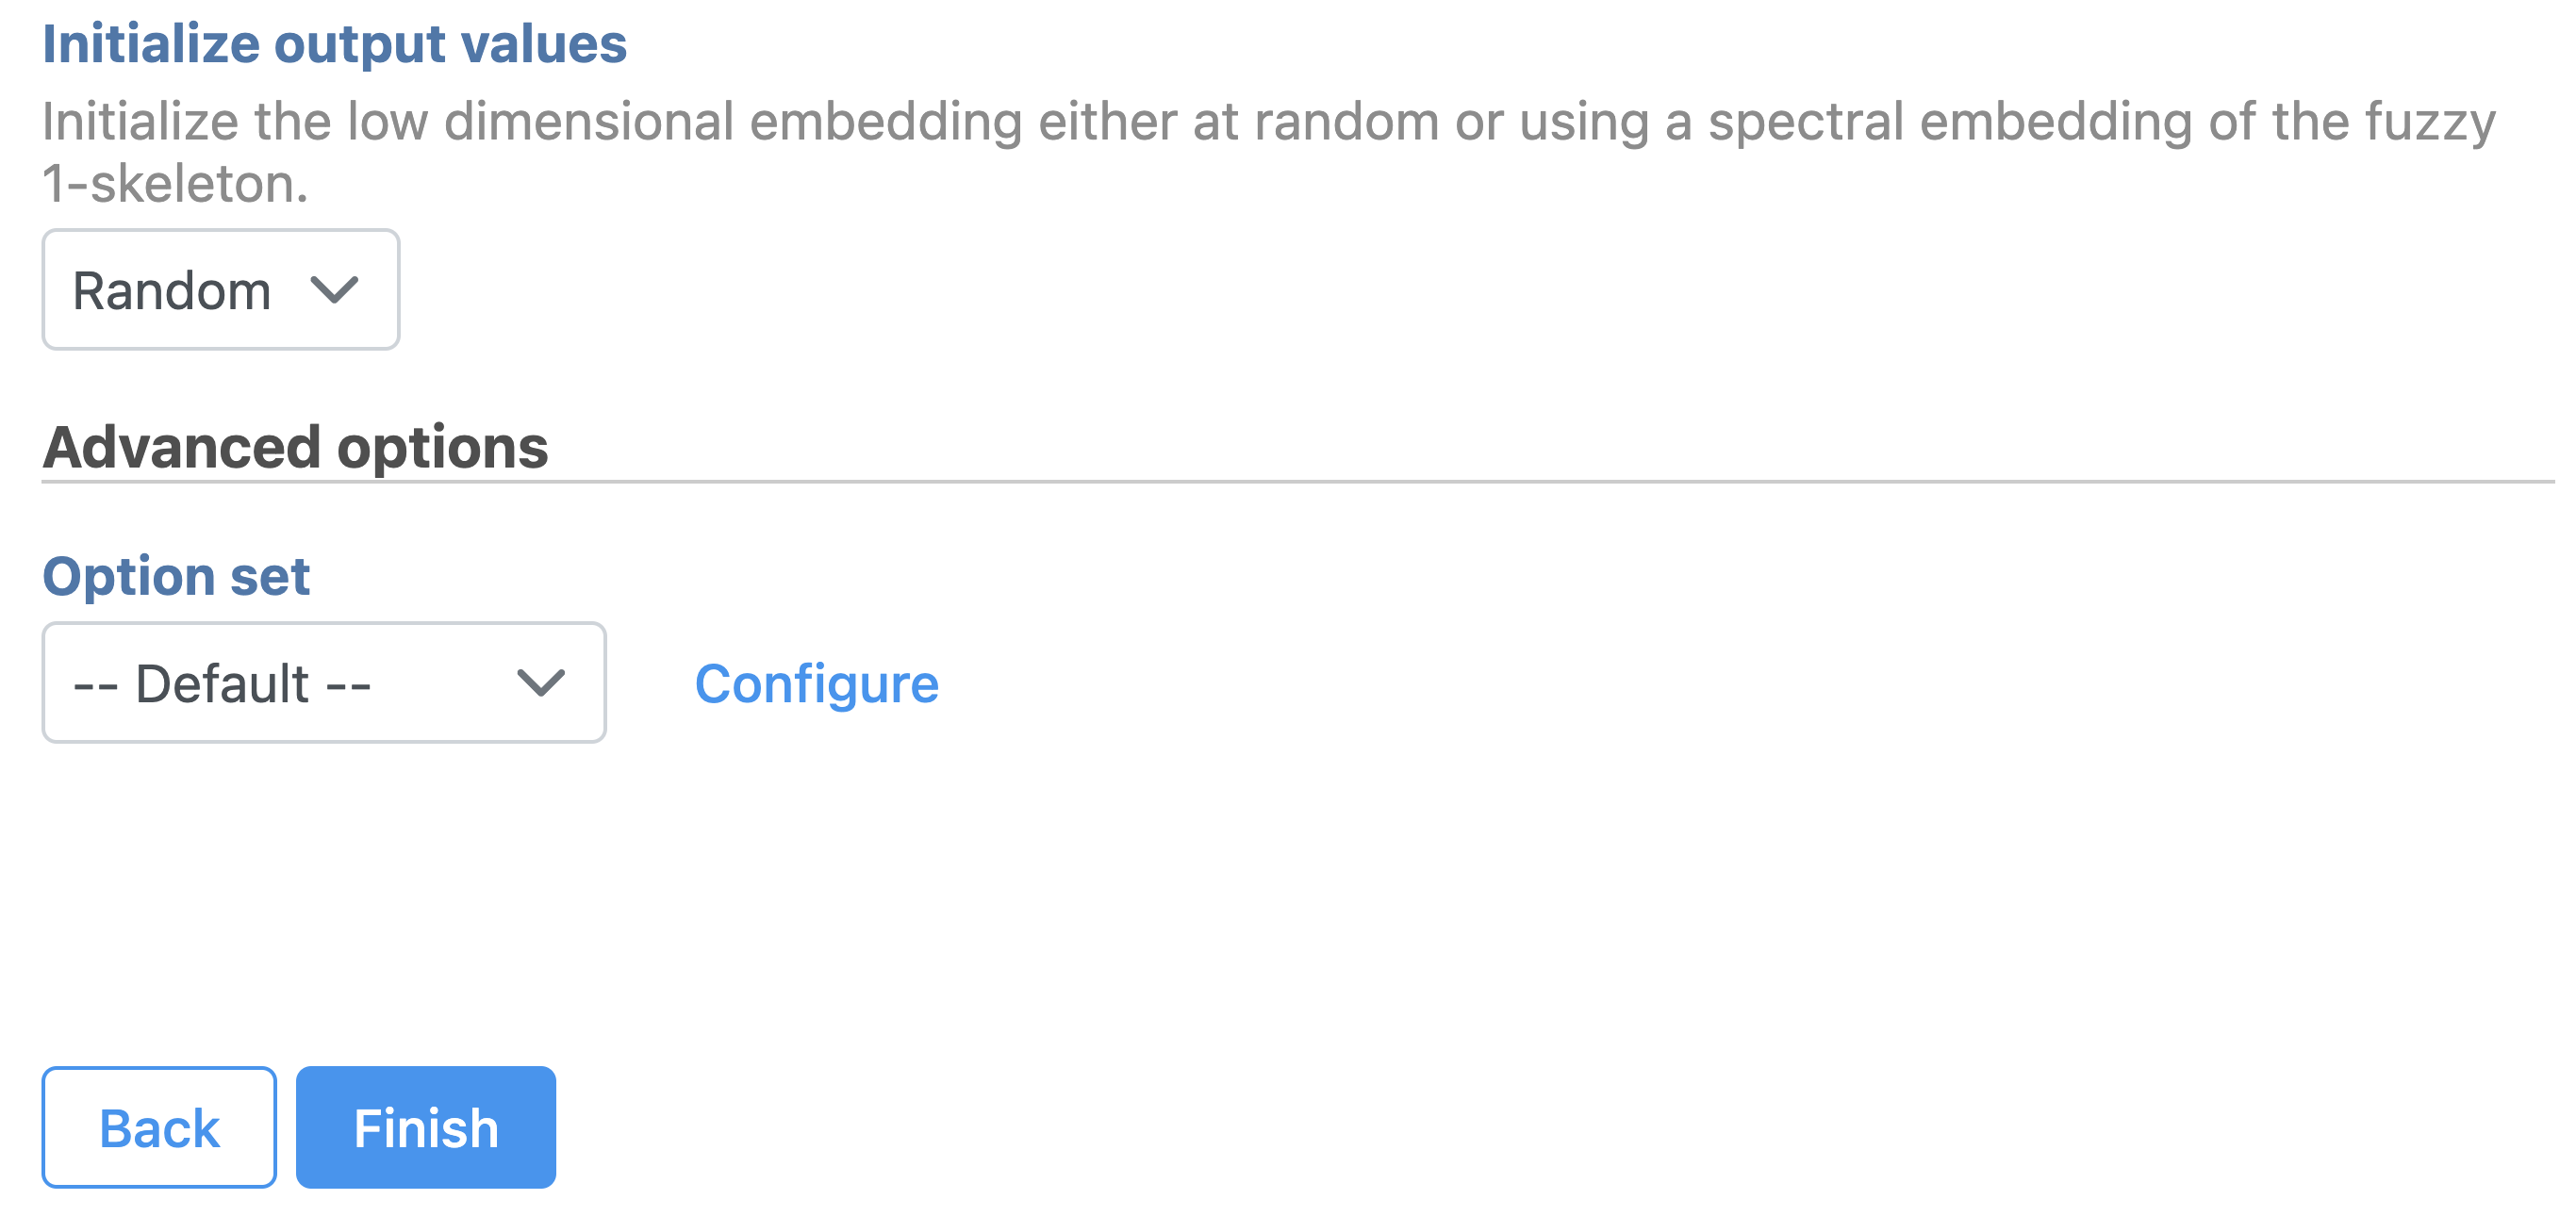
To run TF-IDF normalization,
- Click a single Single cell counts data node, in this case the Annotated regions node
- Click the Normalization and scaling section in the toolbox
- Click TF-IDF normalization
...
| Numbered figure captions | ||||
|---|---|---|---|---|
| ||||
|
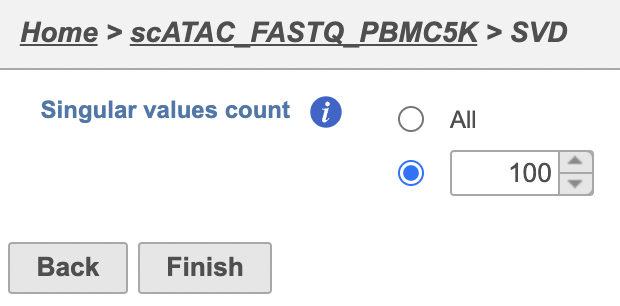
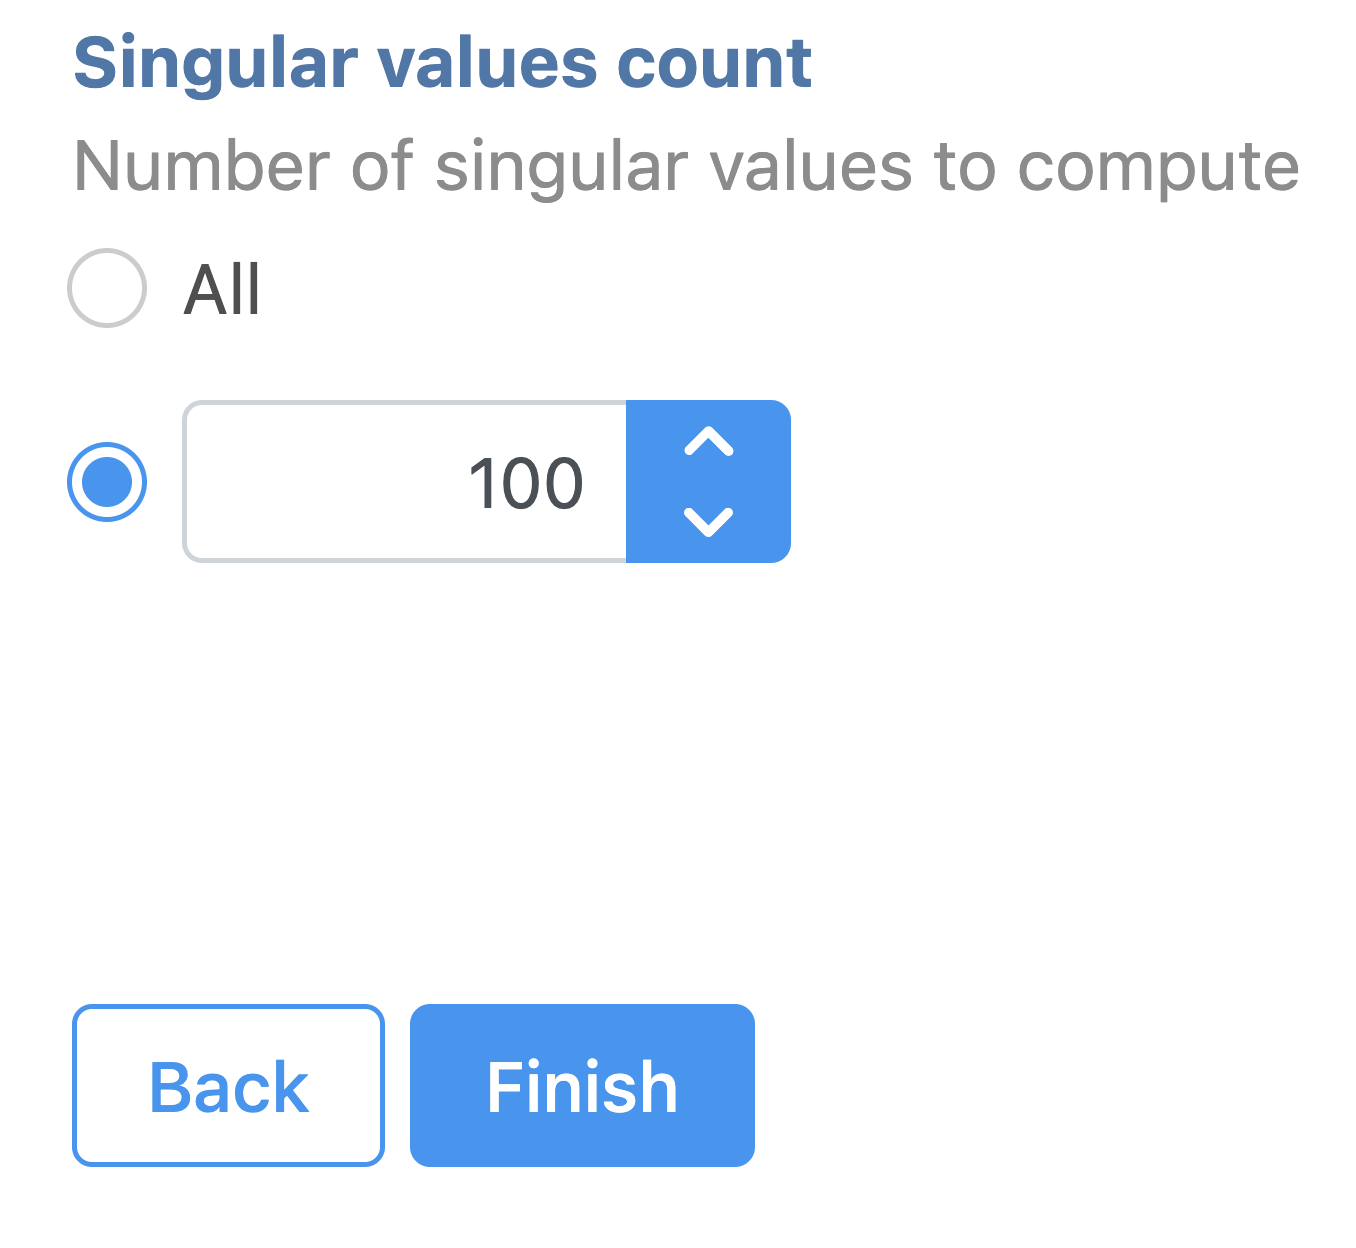
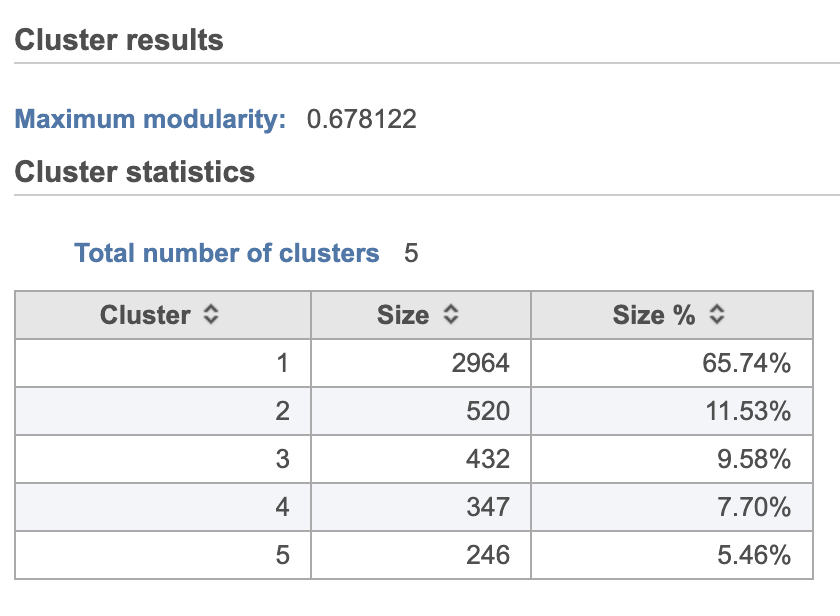
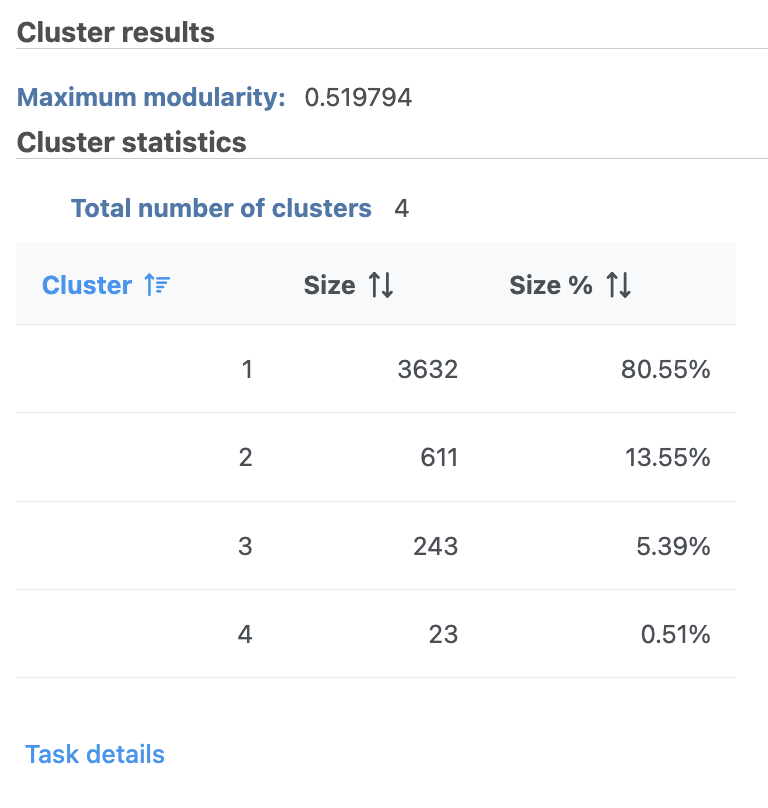
Graph-based clustering
...
| Numbered figure captions | ||||
|---|---|---|---|---|
| ||||
|
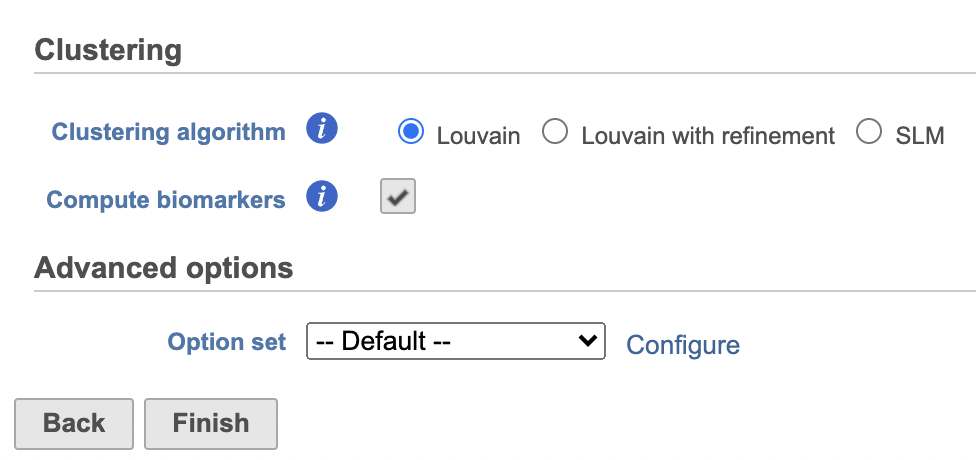
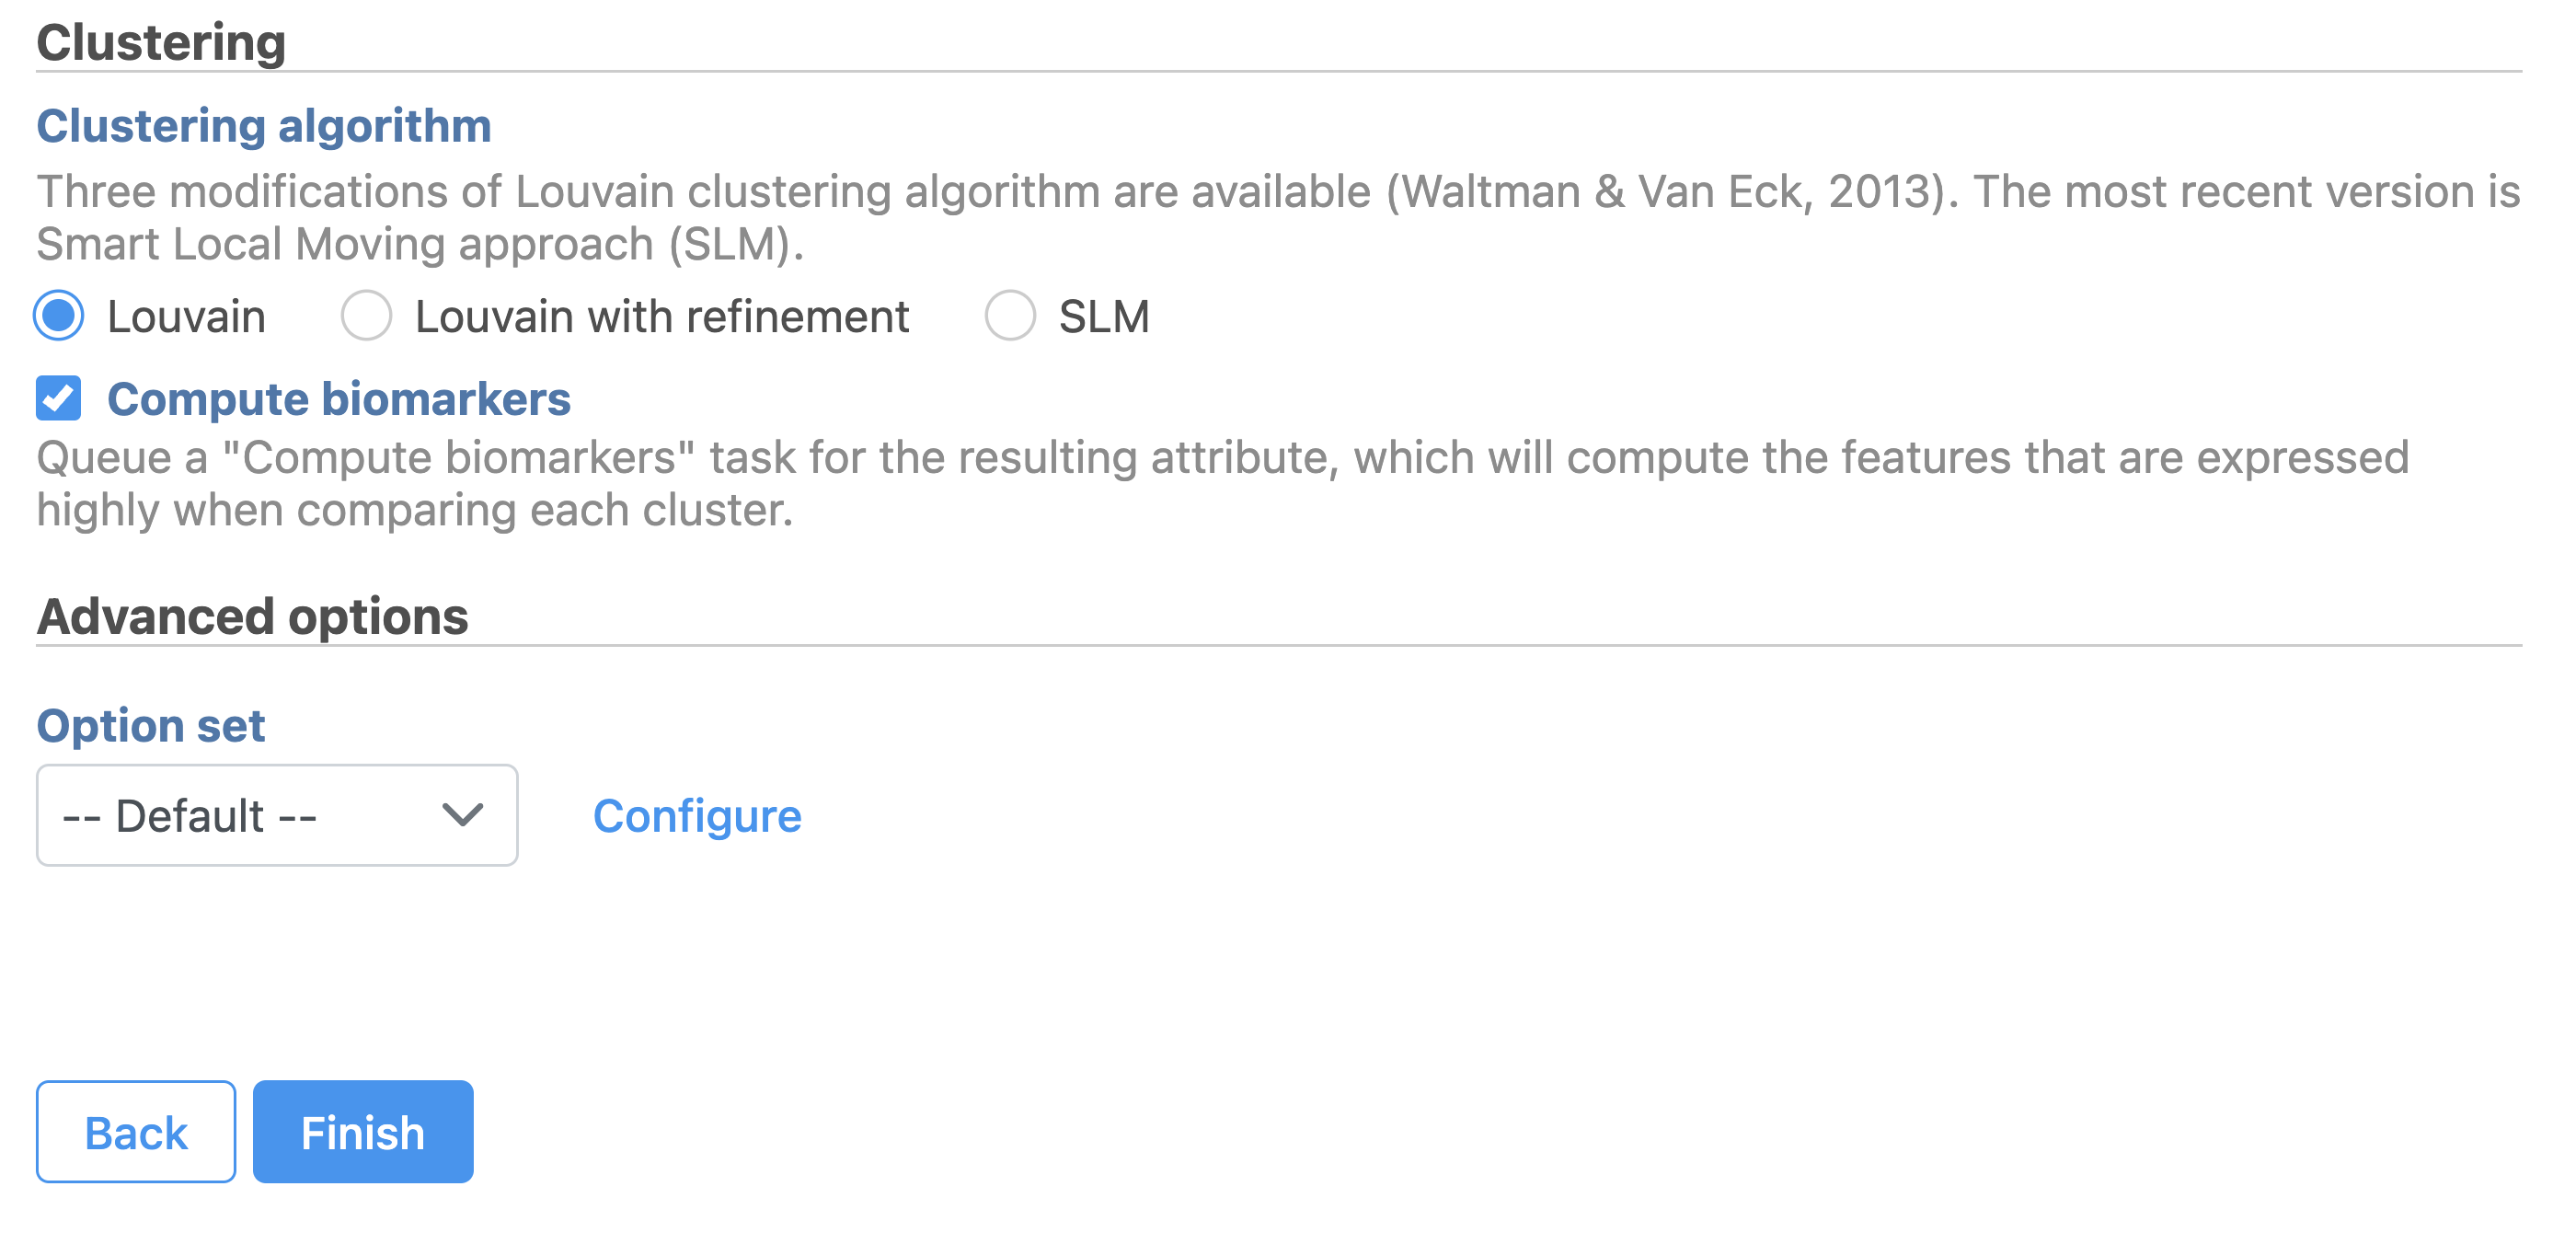
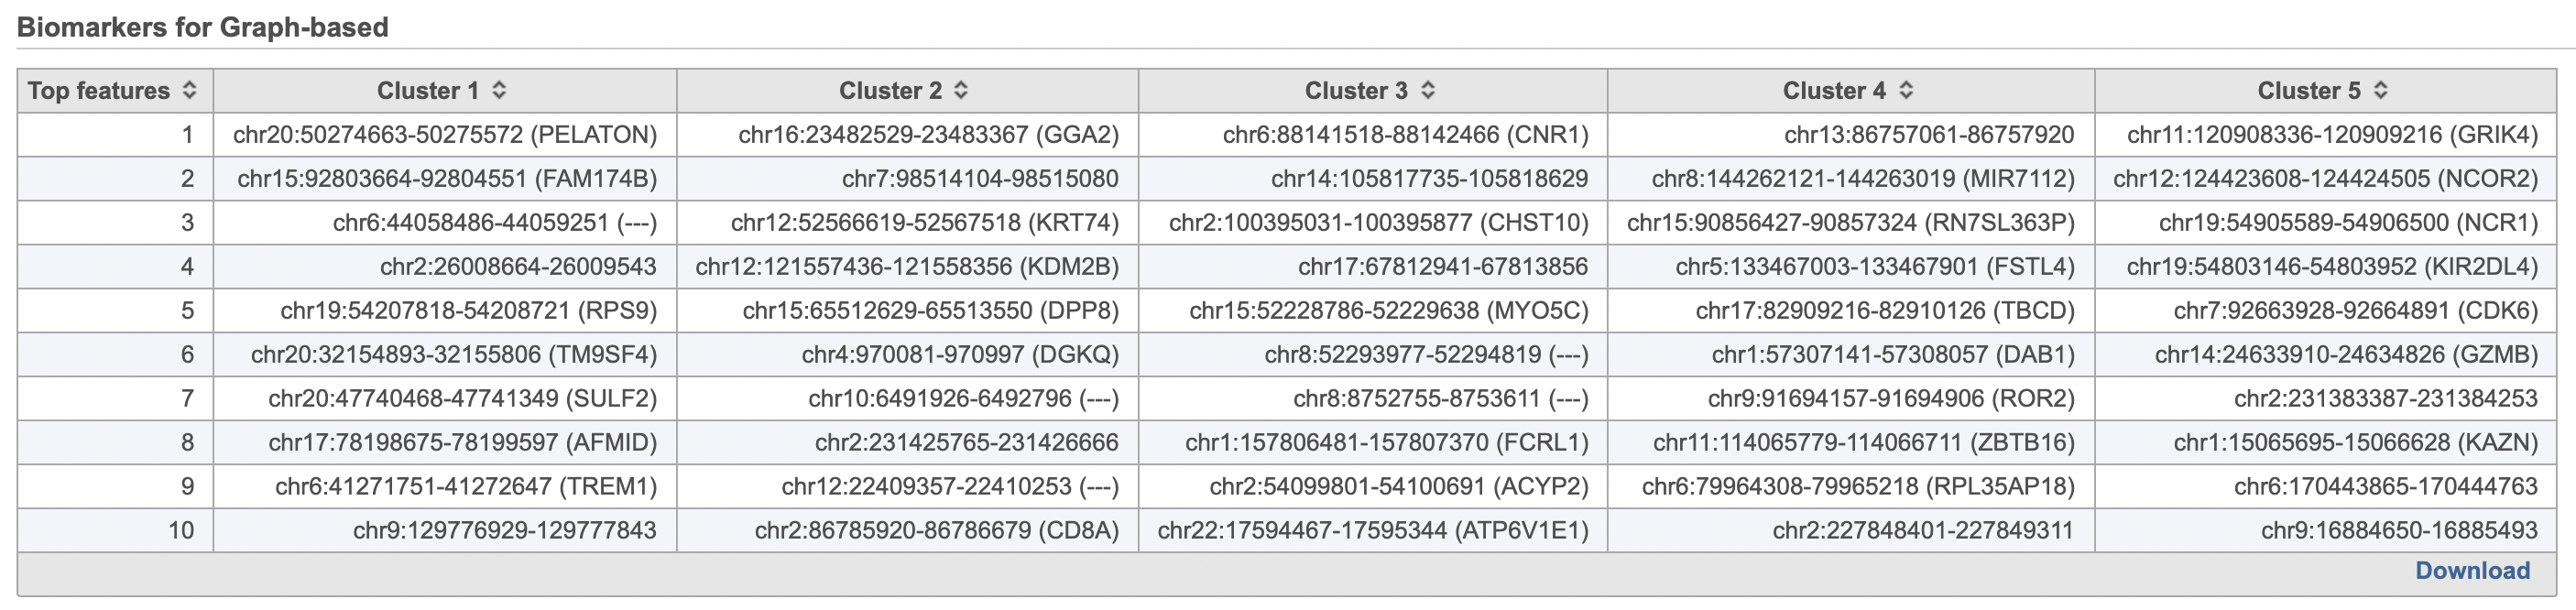
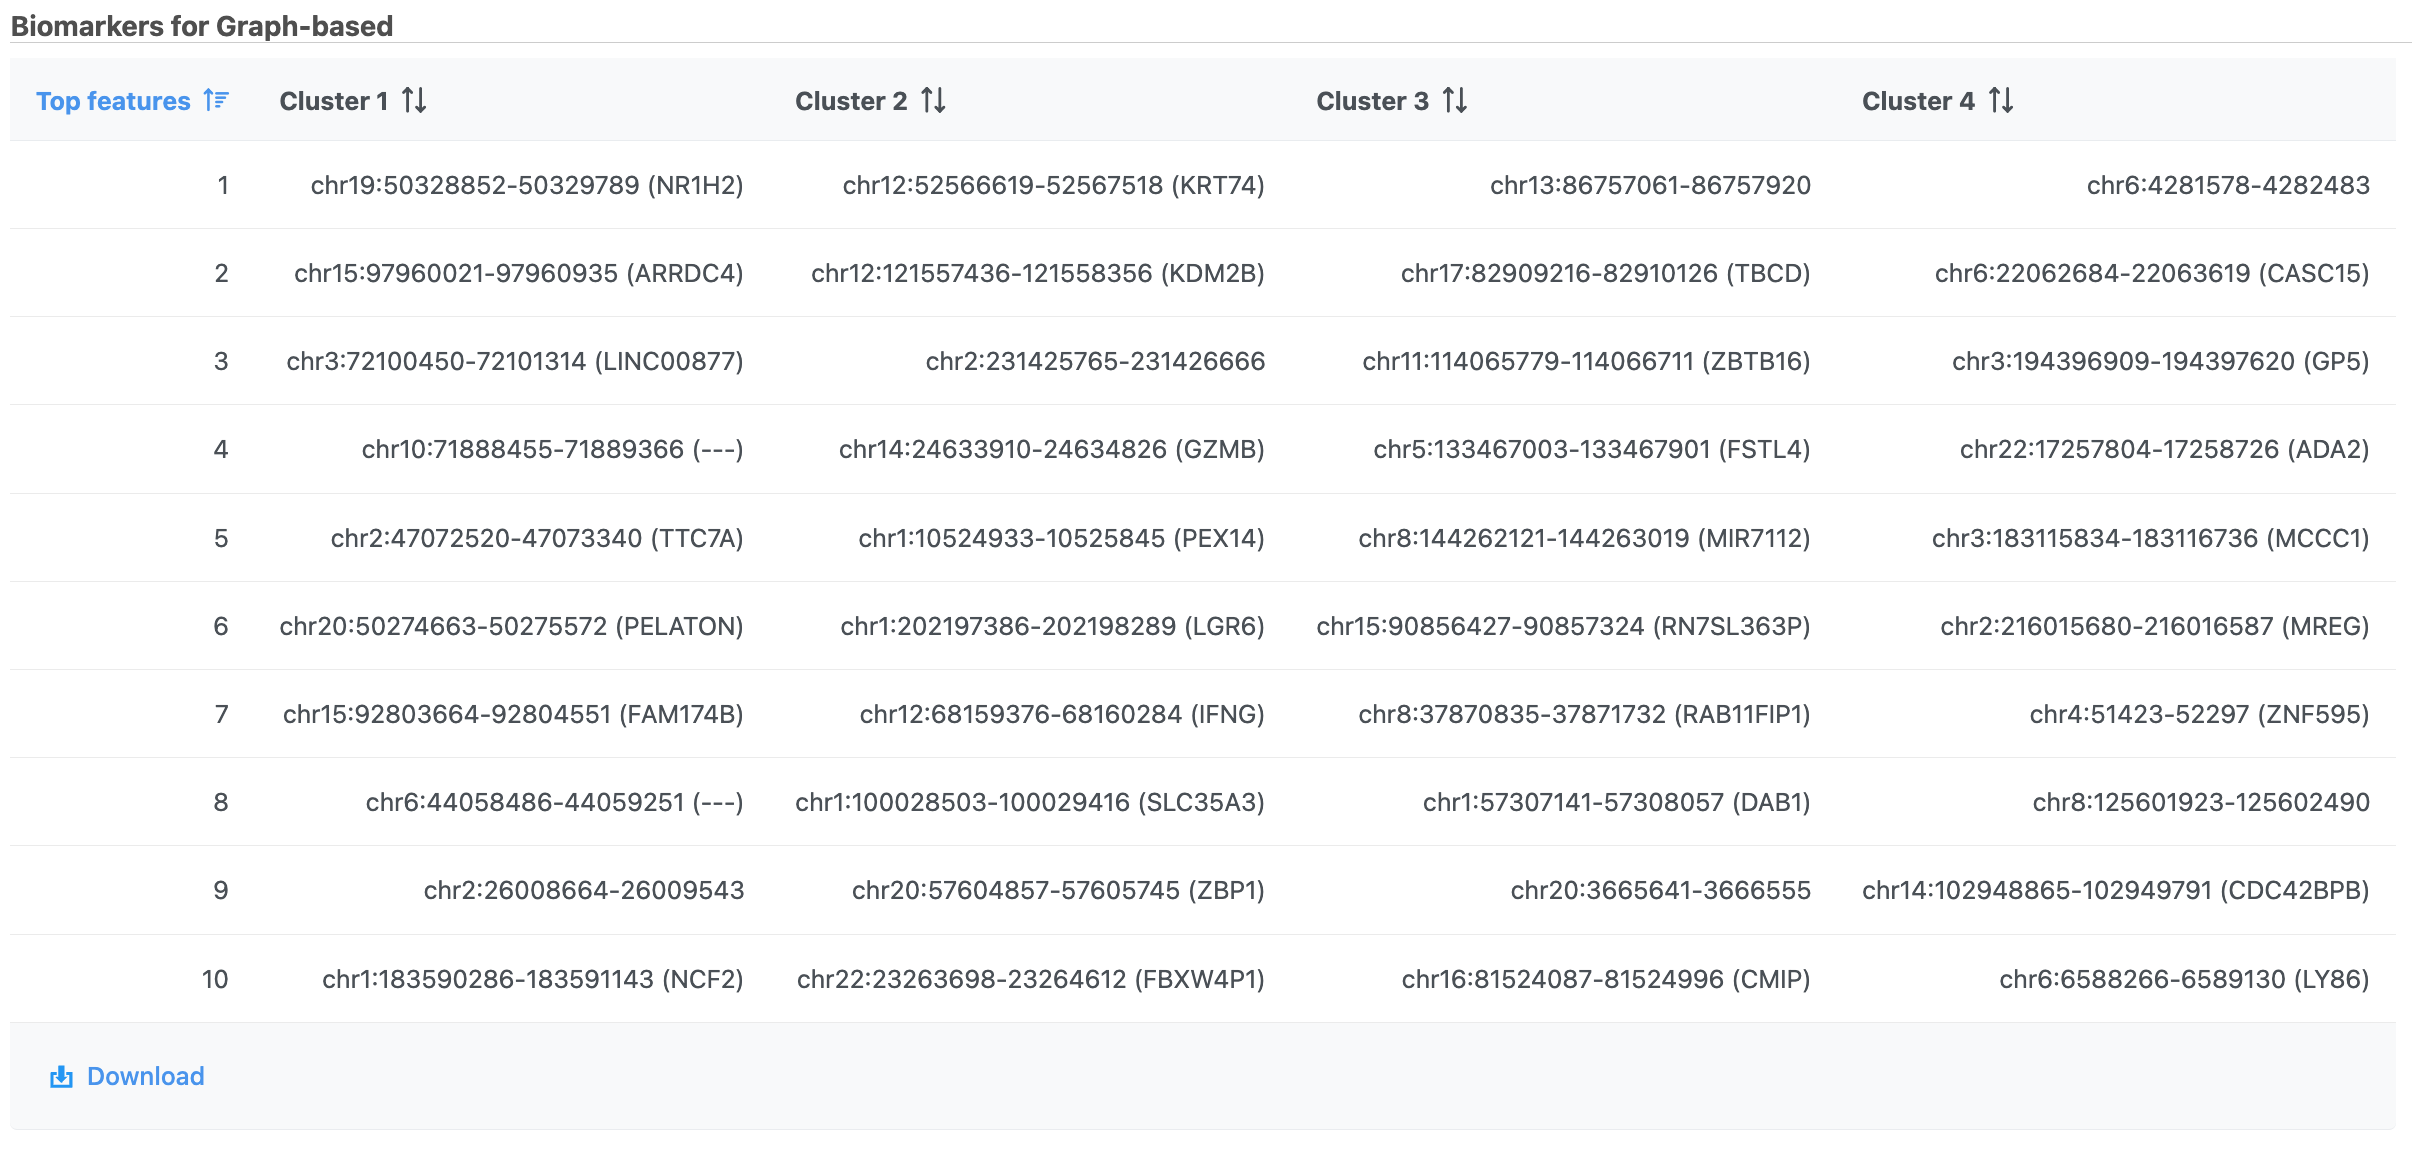
A new Graph-based clusters data and a Biomarkers data node will be generated.
...
| Numbered figure captions | ||||
|---|---|---|---|---|
| ||||
|
| Numbered figure captions | ||||
|---|---|---|---|---|
| ||||
|
UMAP
Similar to t-SNE, Uniform Manifold Approximation and Projection (UMAP) is a dimensional reduction technique. UMAP aims to preserve the essential high-dimensional structure and present it in a low-dimensional representation. UMAP is particularly useful for visually identifying groups of similar samples or cells in large high-dimensional data sets.
...
| Numbered figure captions | ||||
|---|---|---|---|---|
| ||||
|
Promoter sum matrix
...
| Numbered figure captions | ||||
|---|---|---|---|---|
| ||||
|
Classifying cells
...
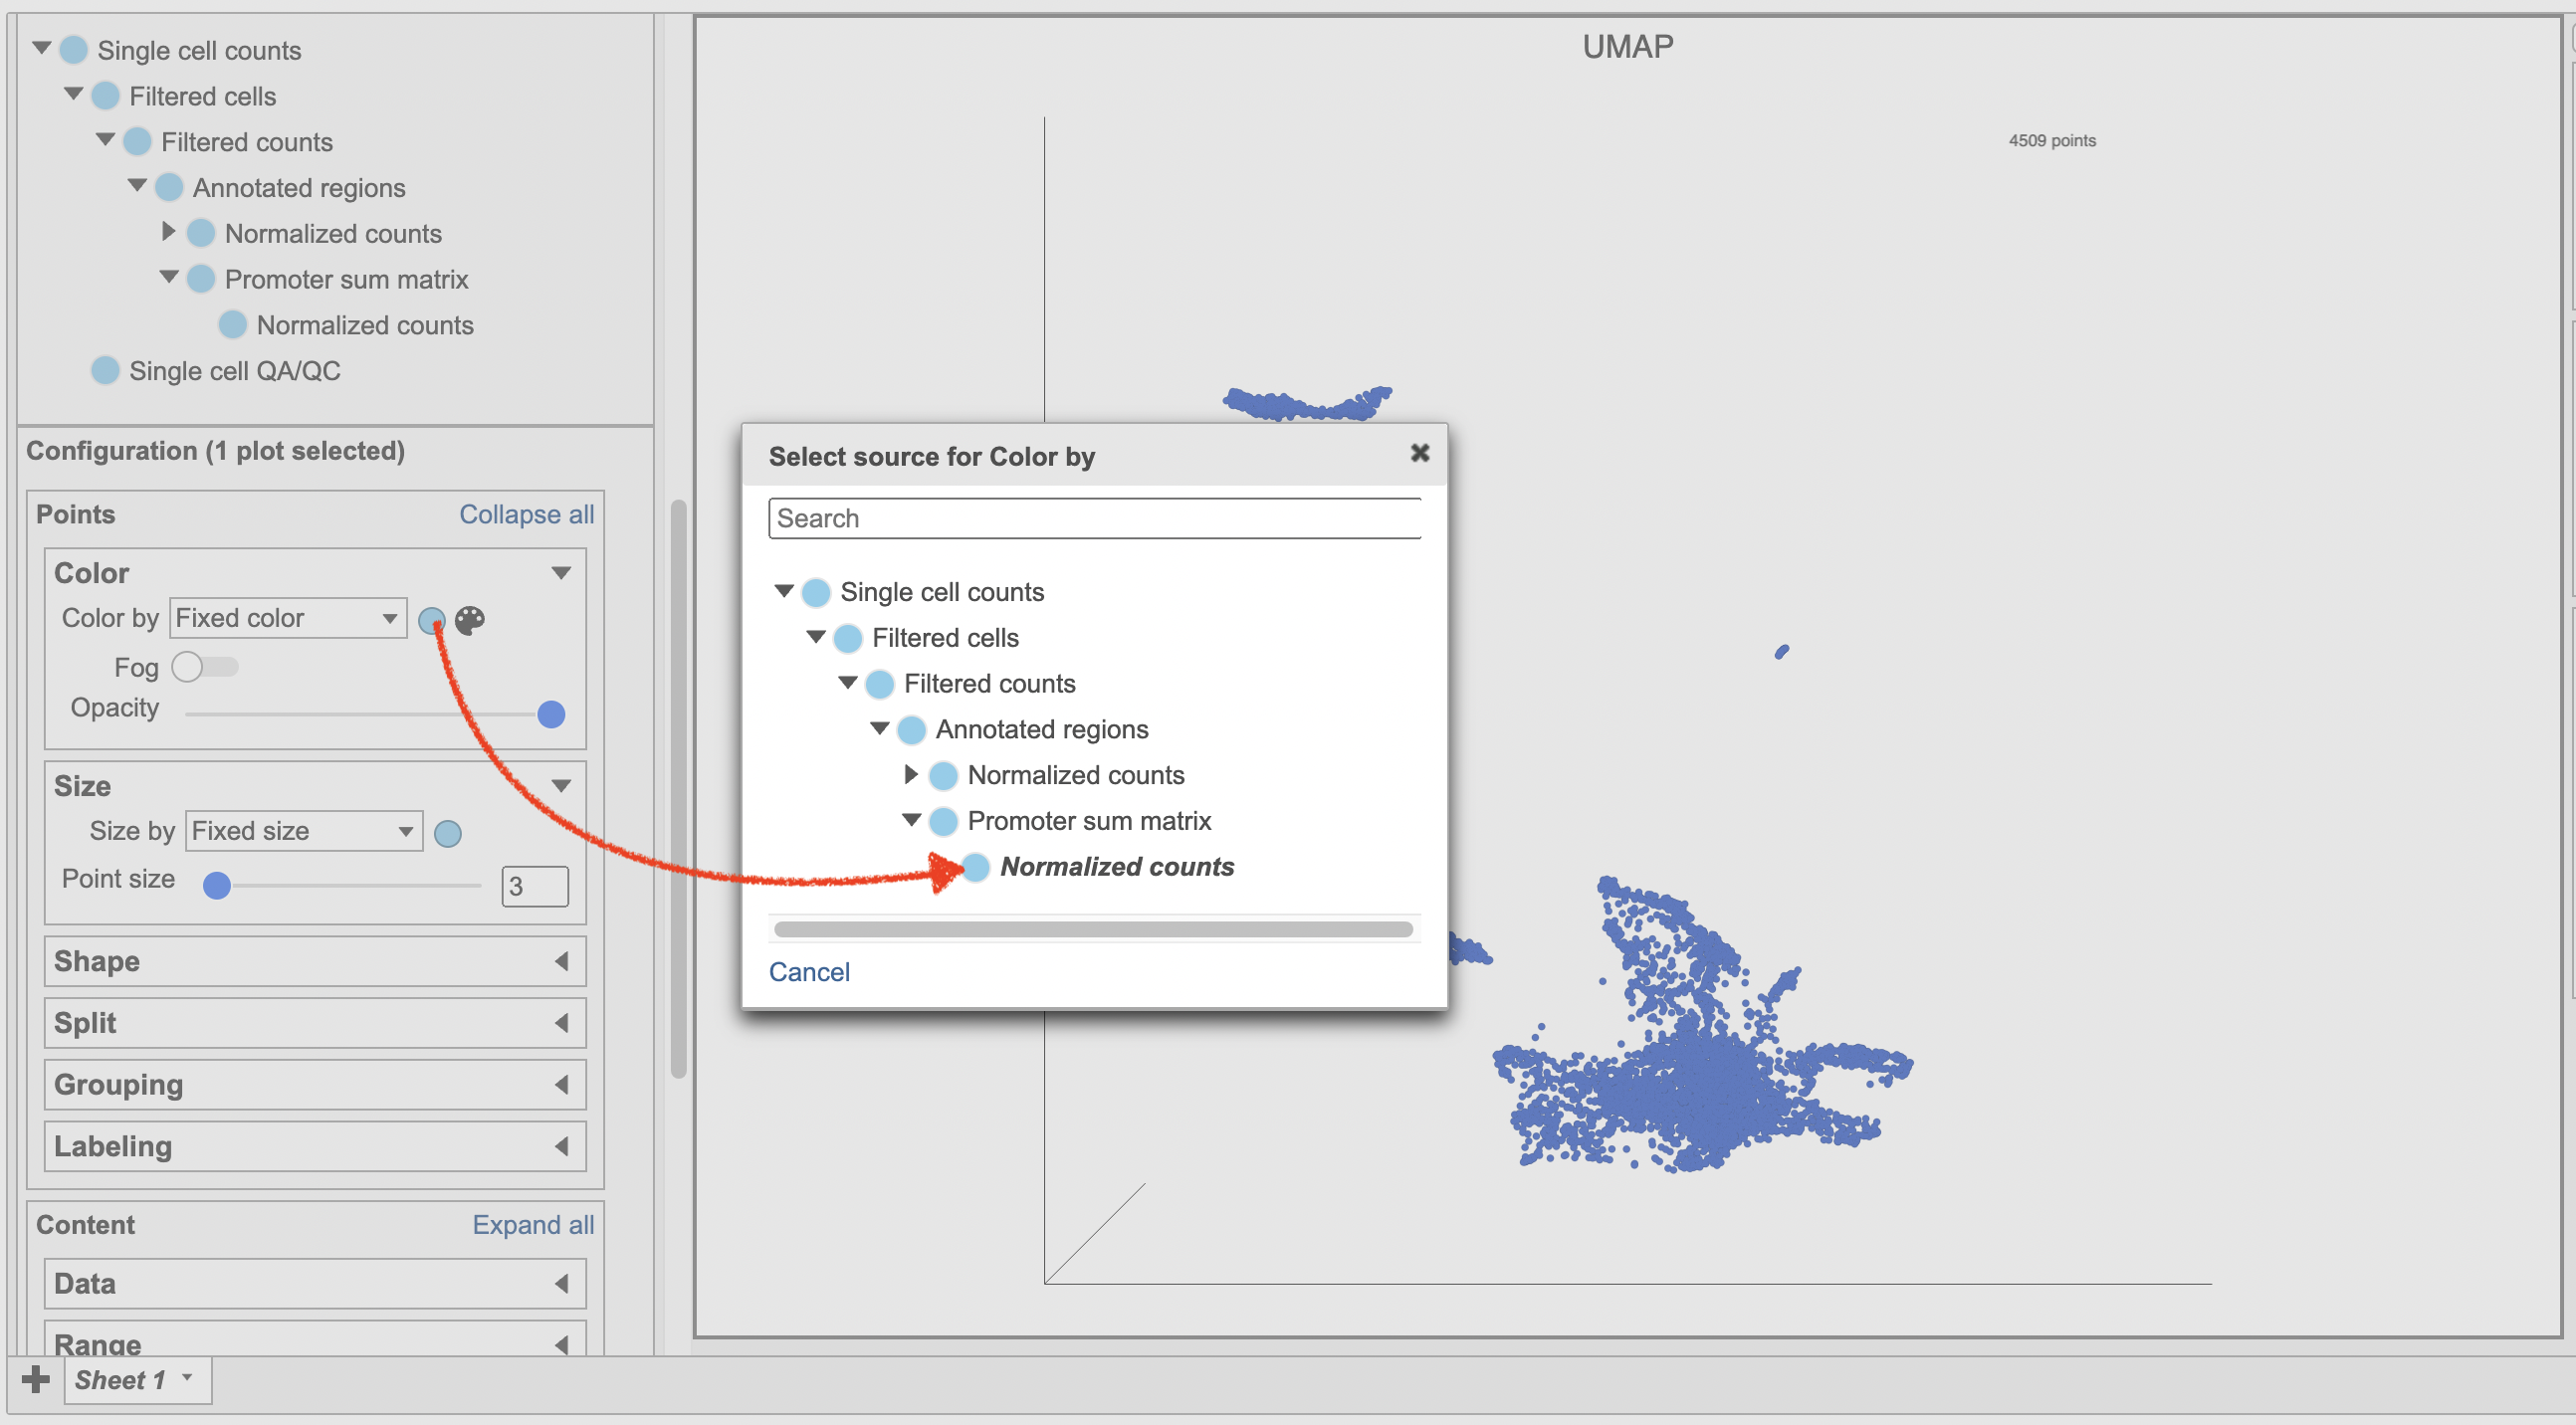
- Make sure the right data source has been selected. For scATAC-seq data, it shall be the normalized counts of promoter sum values in most cases (Figure 17)
- Set Color by in the Style configuration to the normalized counts node
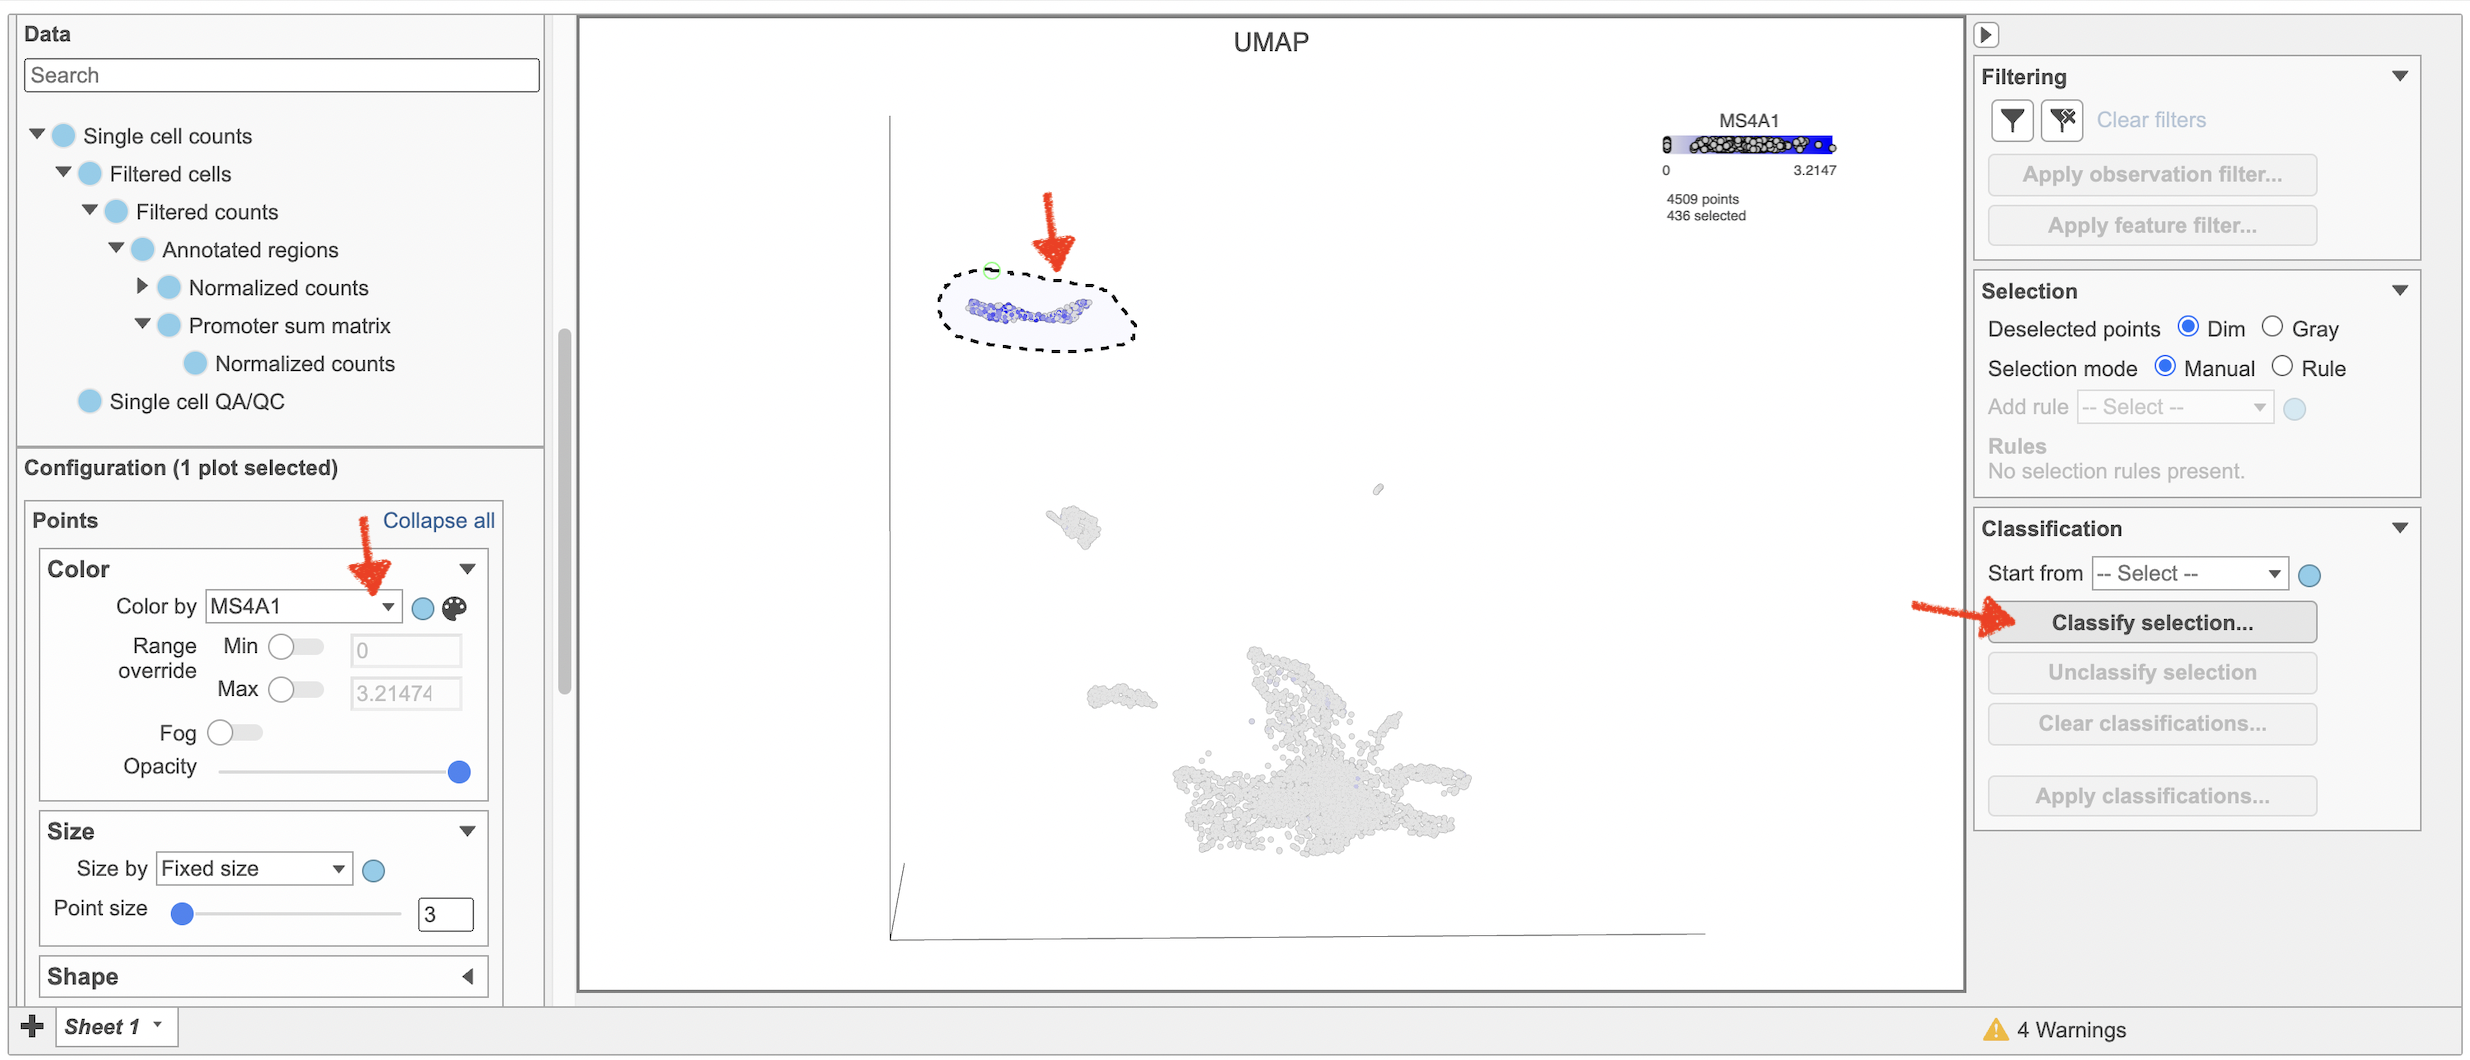
- Type MS4A1 in the search box and select it. Rotate the 3D plot if you need to see this cluster more clearly.
- Click Click
 to activate Lasso mode
 - Draw a lasso around the cluster of MS4A1-expressing cells
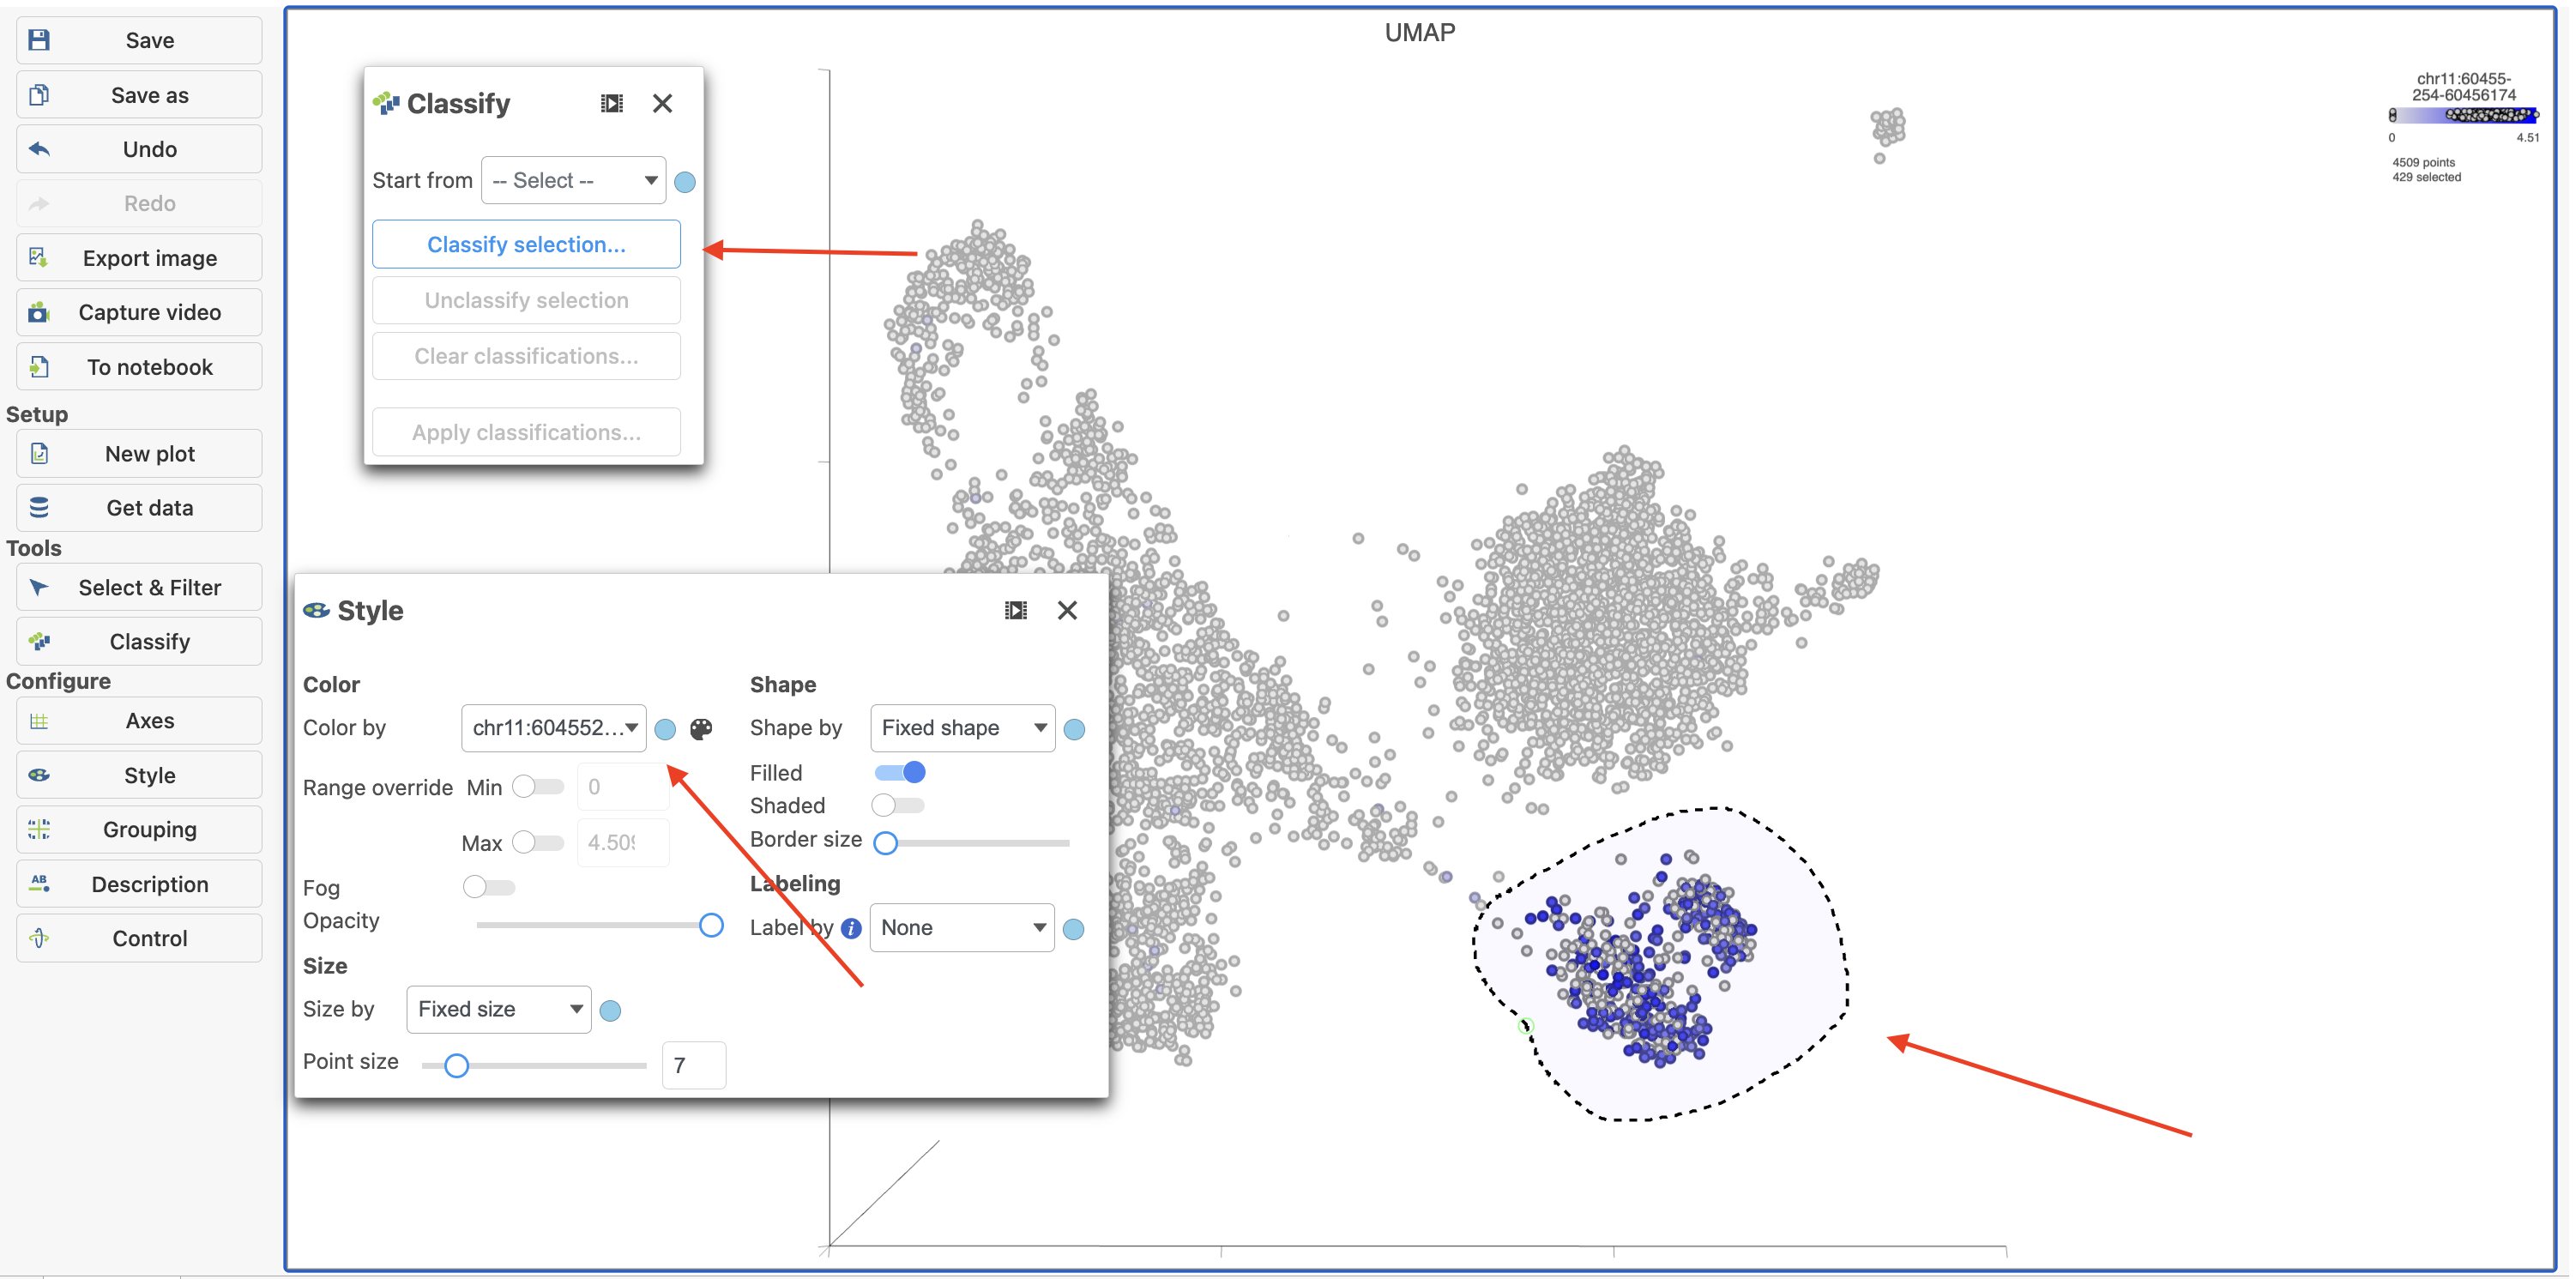
- Click Classify selection under Tools in the left panel
- Type B cells for the Name
- Click Save (Figure 18)
...
| Numbered figure captions | ||||
|---|---|---|---|---|
| ||||
|

| Numbered figure captions | ||||
|---|---|---|---|---|
| ||||
|
Differential analysis
...
| Numbered figure captions | ||||
|---|---|---|---|---|
| ||||
|
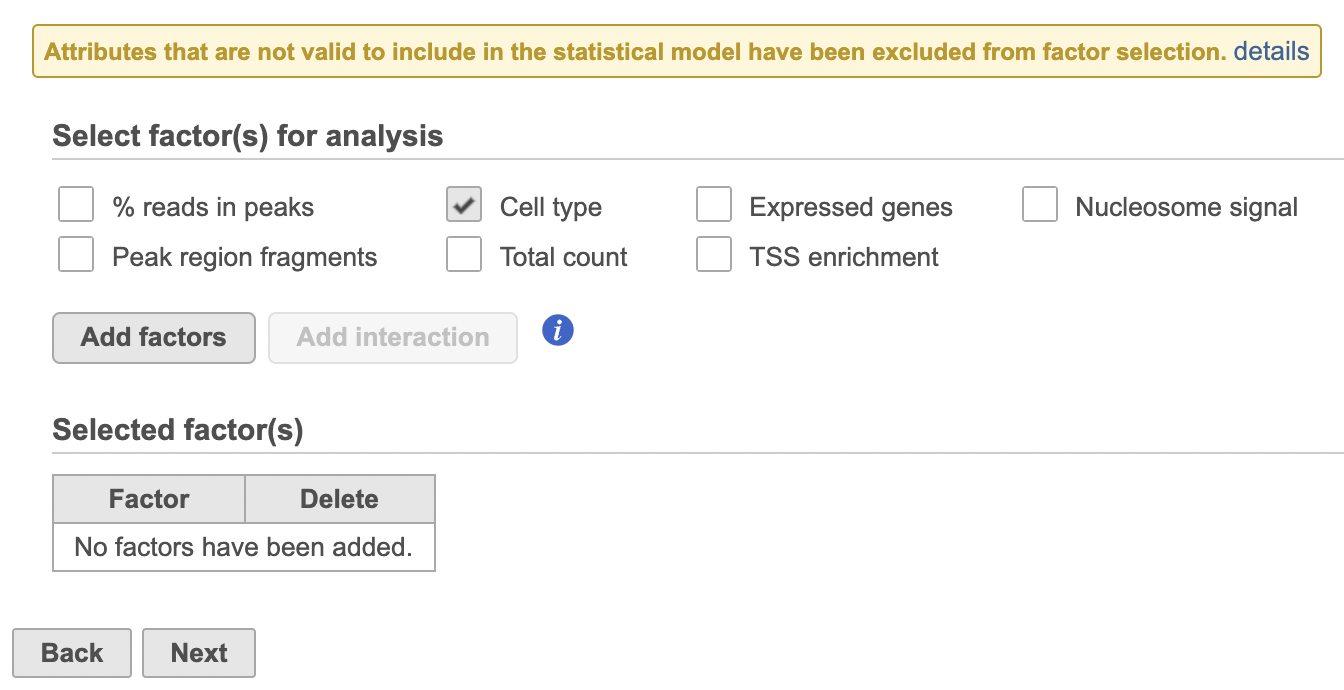
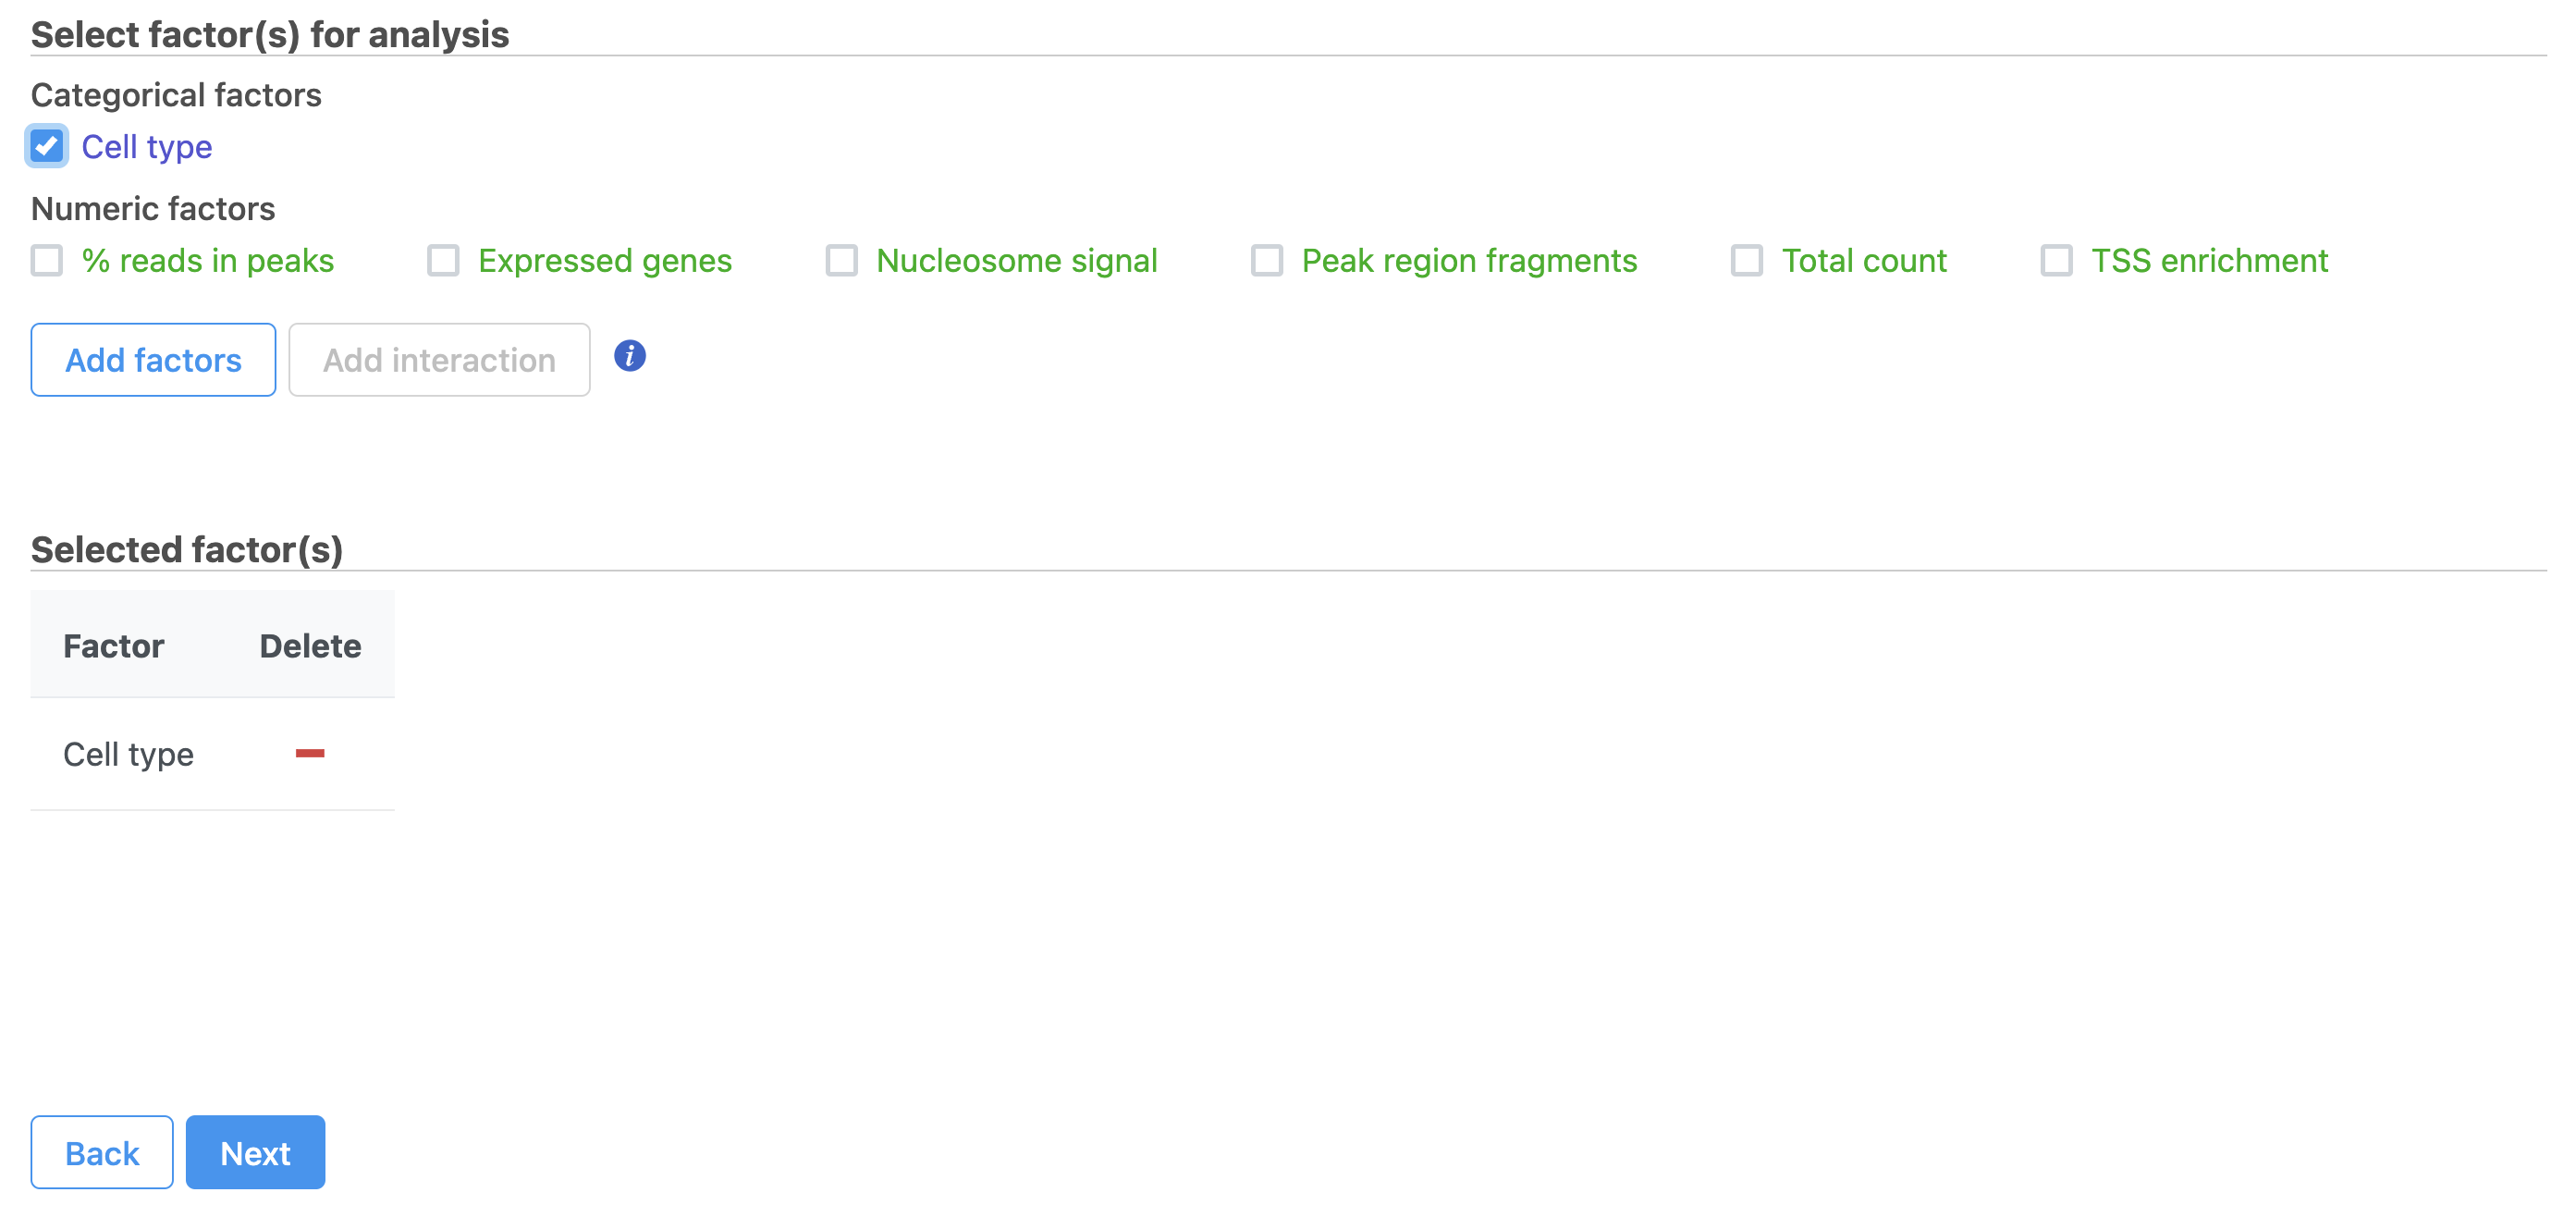
- Click Next
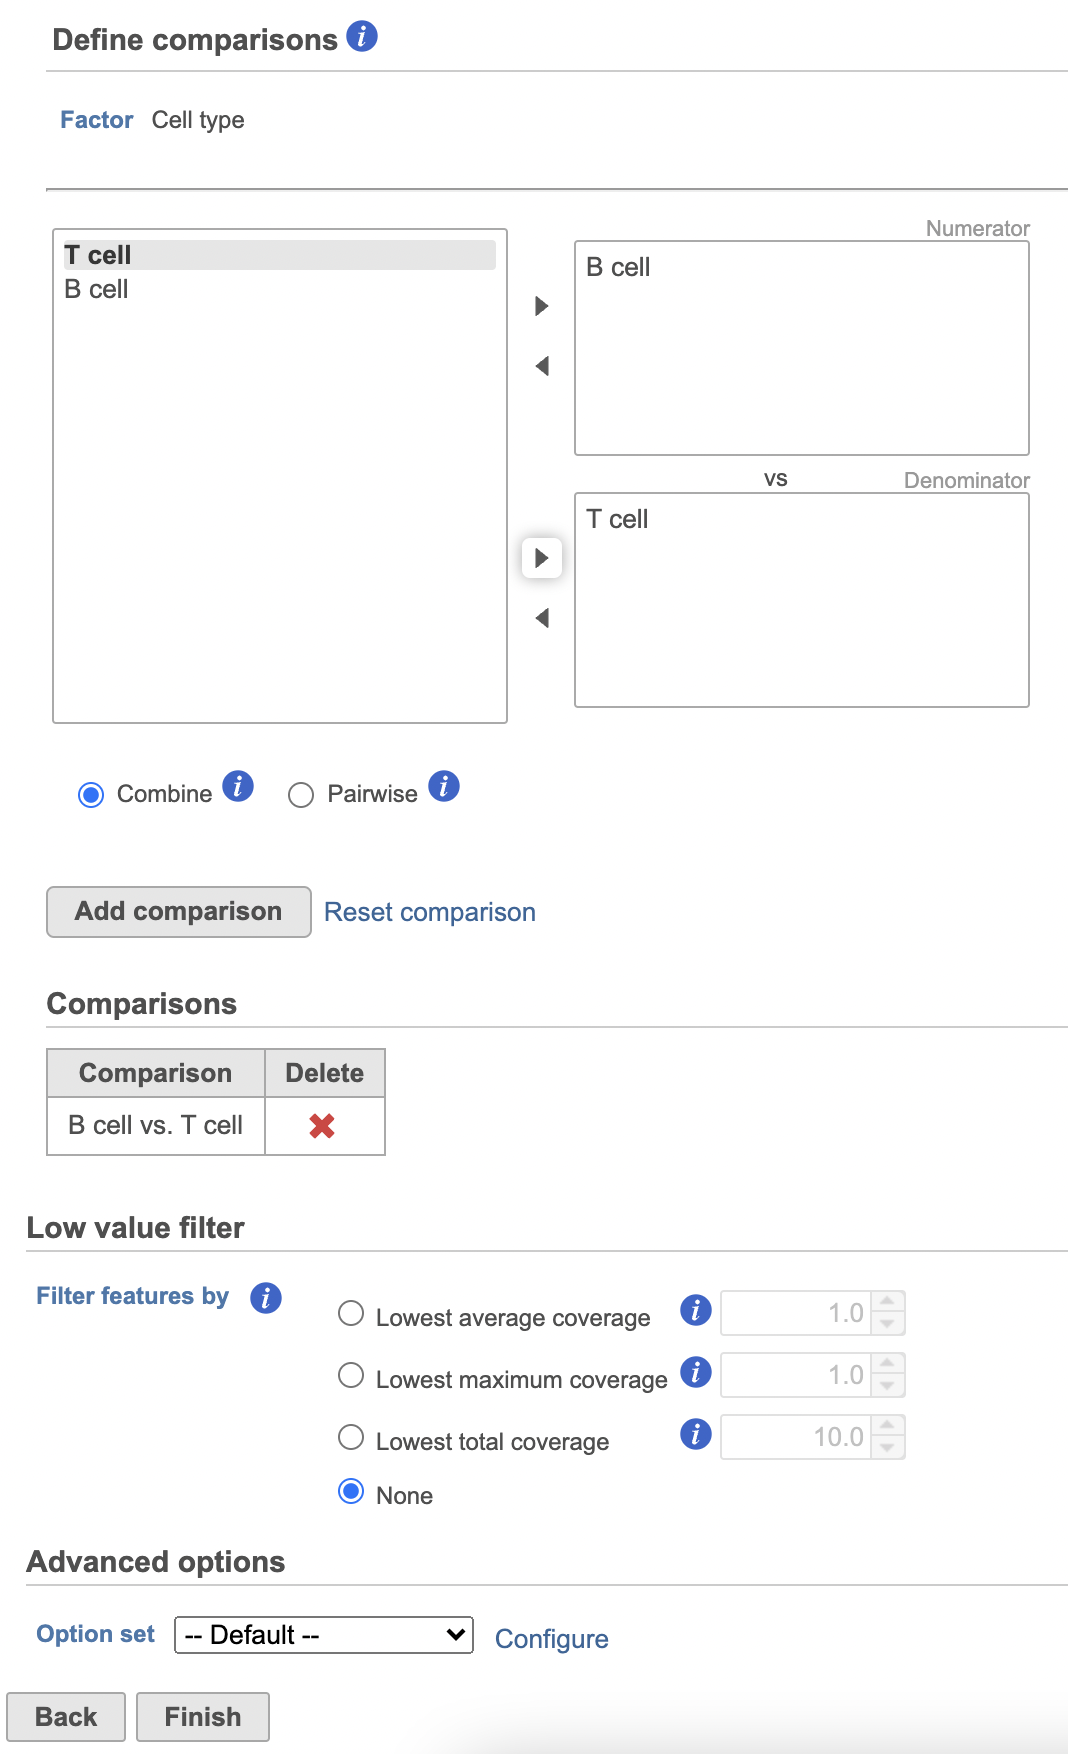
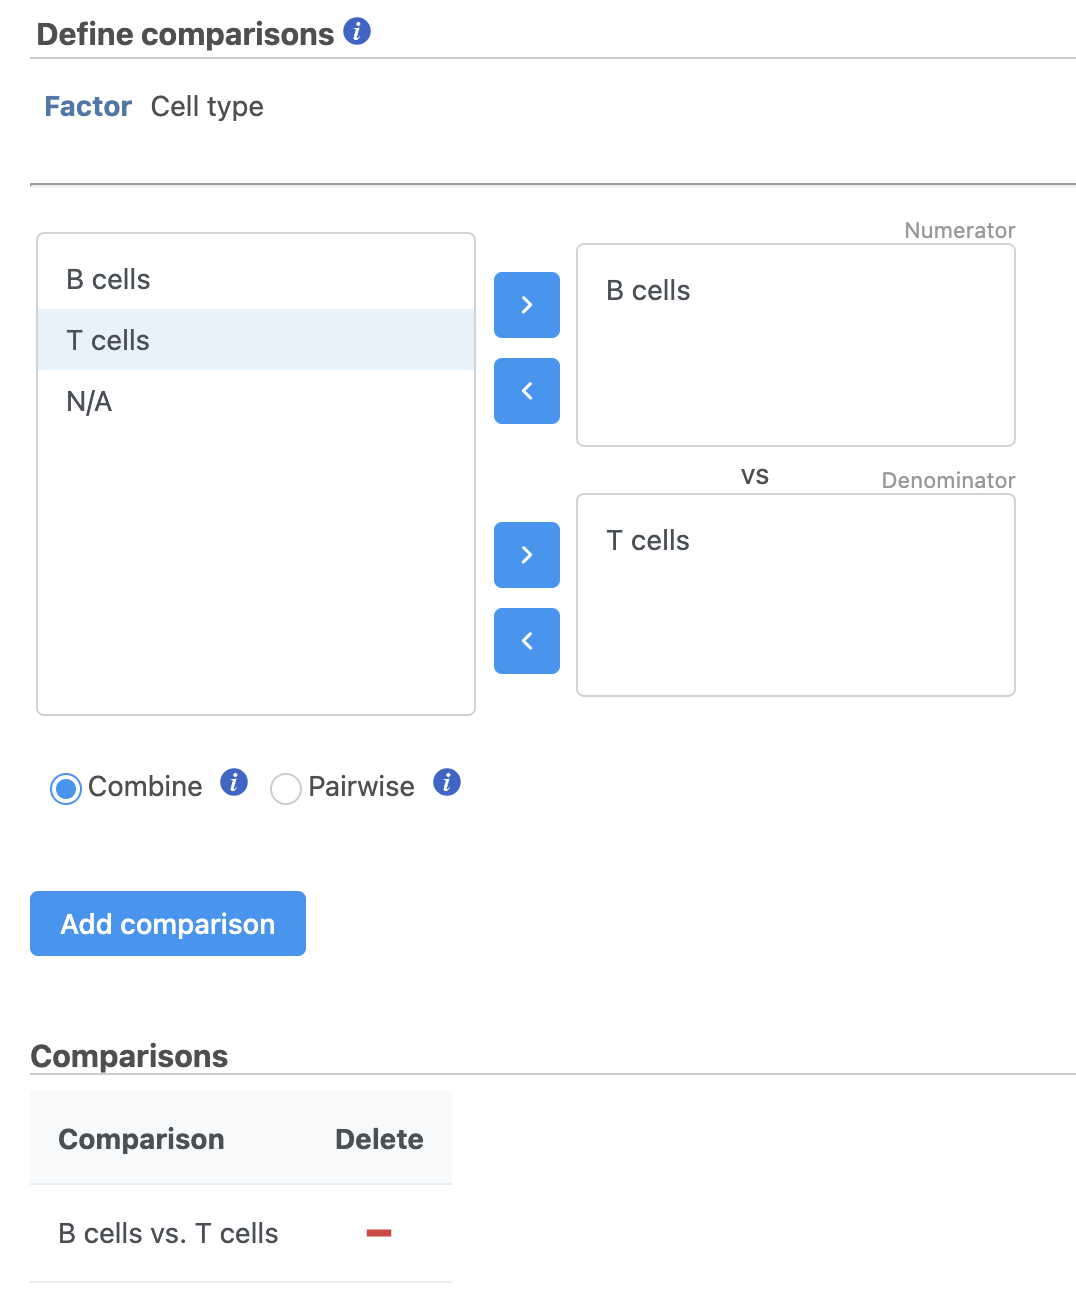
- Define comparisons between factor or interaction levels (Figure 20)
- Click Add comparison to add the comparison to the Comparisons table.
- Click Finish to run the statistical test as default
| Numbered figure captions | ||||
|---|---|---|---|---|
| ||||
|
Hurdle model produces a Feature list task node. The results table and options are the same as the GSA task report except the last two columns. The percentage of cells where the feature is detected (value is above the background threshold) in different groups (Pct(group1), Pct(group2)) are calculated and included in the Hurdle model report.
...
| Numbered figure captions | ||||
|---|---|---|---|---|
| ||||
| ||||
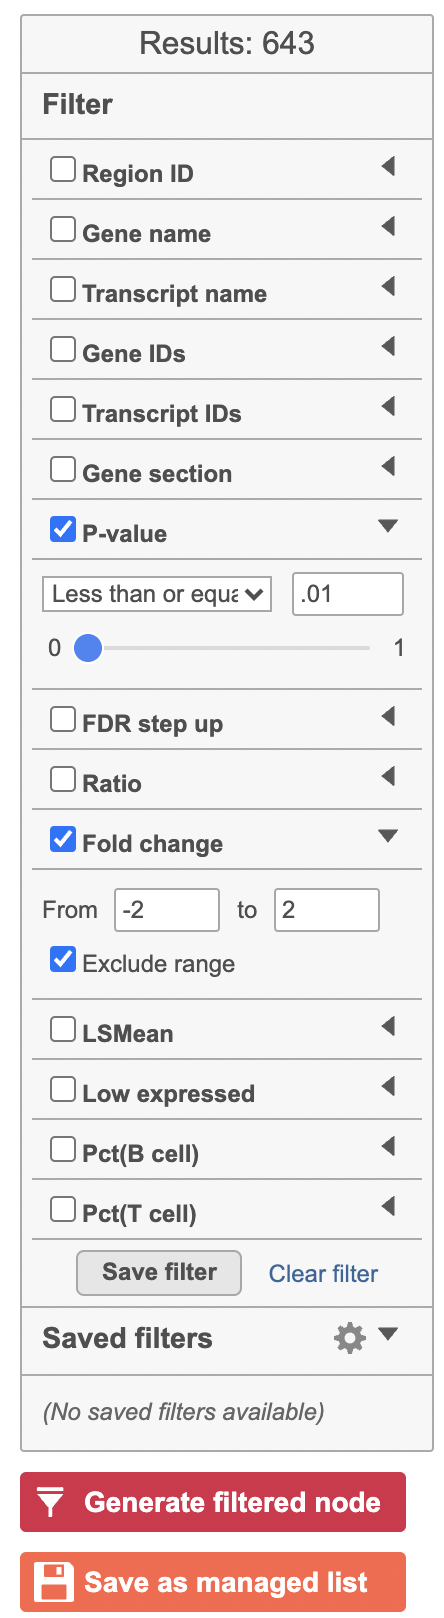
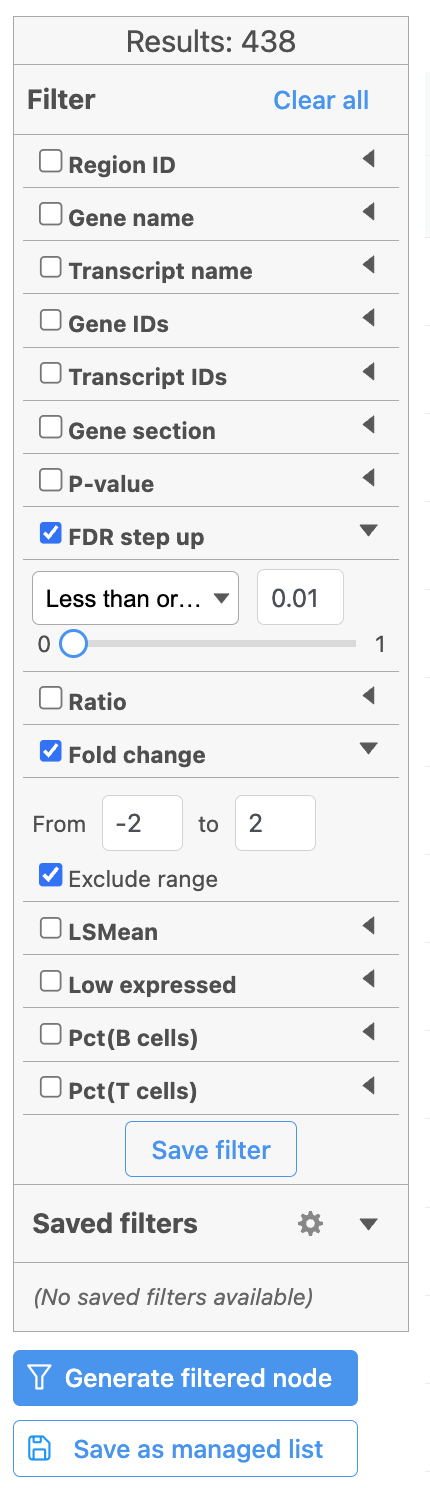 Once we have filtered a list of differentially expressed genes, we can visualize these genes by generating a heatmap, or perform the Gene set enrichment analysis and motif detection.
...
Overview
Content Tools