Page History
...
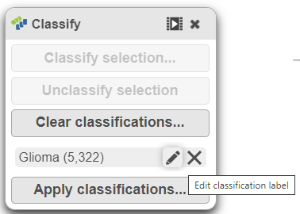
There should be 5,322 glioma cells in total across all 8 samples.
- The classification name can be edited or deleted (Figure 18).
| Numbered figure captions | ||||
|---|---|---|---|---|
| ||||
|
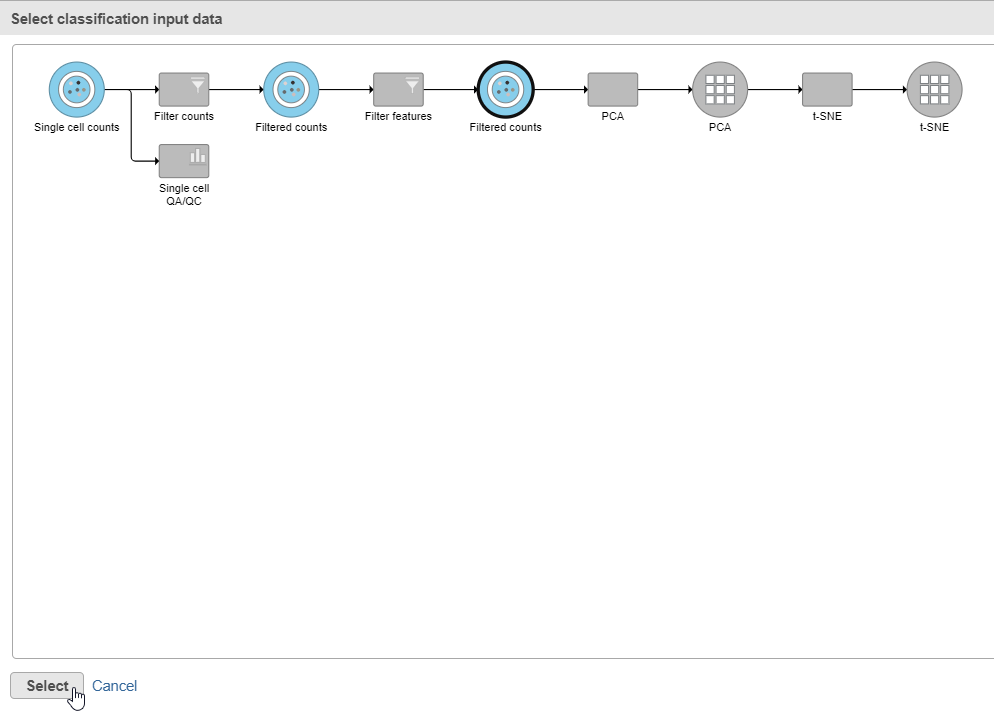
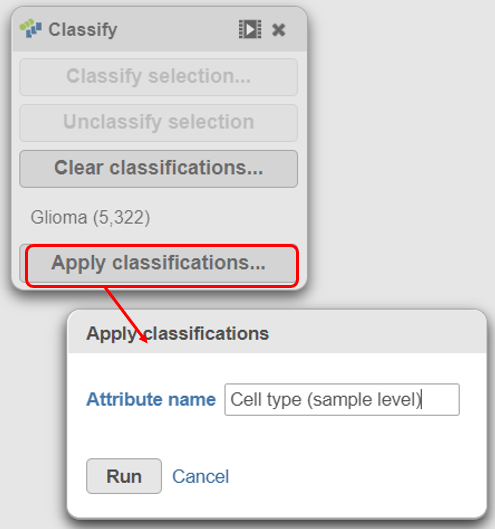
With the malignant cells in every sample classified, it is time to save the classifications.
- Click Apply classifications in the Classification card on the right
- Click the Filtered counts data node as input data for the classification task (Figure 18)
- Click Select
| Numbered figure captions | ||||
|---|---|---|---|---|
| ||||
|
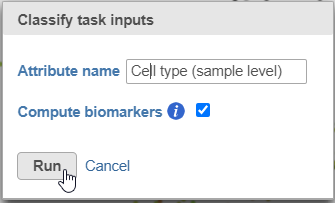
- Classify icon
- Name the classification attribute Cell type (sample level)
- Click Run (Figure 19)
- Click Run
- Click OK on the information box that says a classification task has been enqueued
| Numbered figure captions | ||||
|---|---|---|---|---|
| ||||
  |
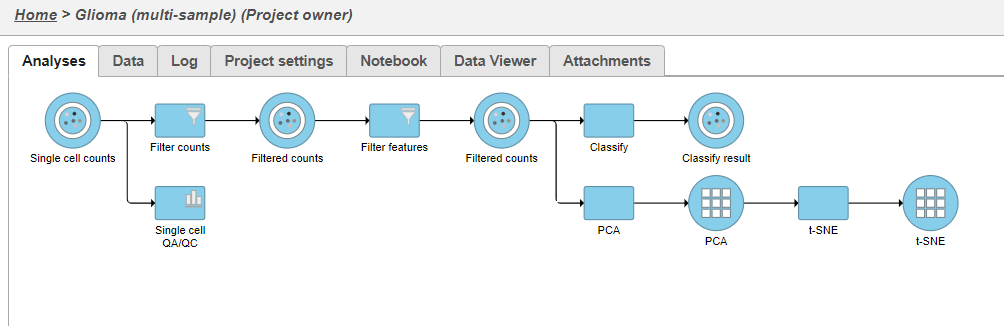
A new task, Classify, is added to the Analyses tab. This task produces a new Classify result data node (Figure 20).
...
| Numbered figure captions | ||||
|---|---|---|---|---|
| ||||
|
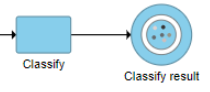
- Double-click the new Classify result data node to open the task report (Figure 21)
...
Overview
Content Tools