Page History
...
The Single cell QA/QC task report opens in a new data viewer session. Three Four dot and violin plots showing the value of every cell in the project are displayed on the canvas: counts per cell, detected features per cell, the percentage of mitochondrial counts per cell, and the percentage of ribosomal counts per cell (Figure 2).
| Numbered figure captions | ||||
|---|---|---|---|---|
| ||||
|
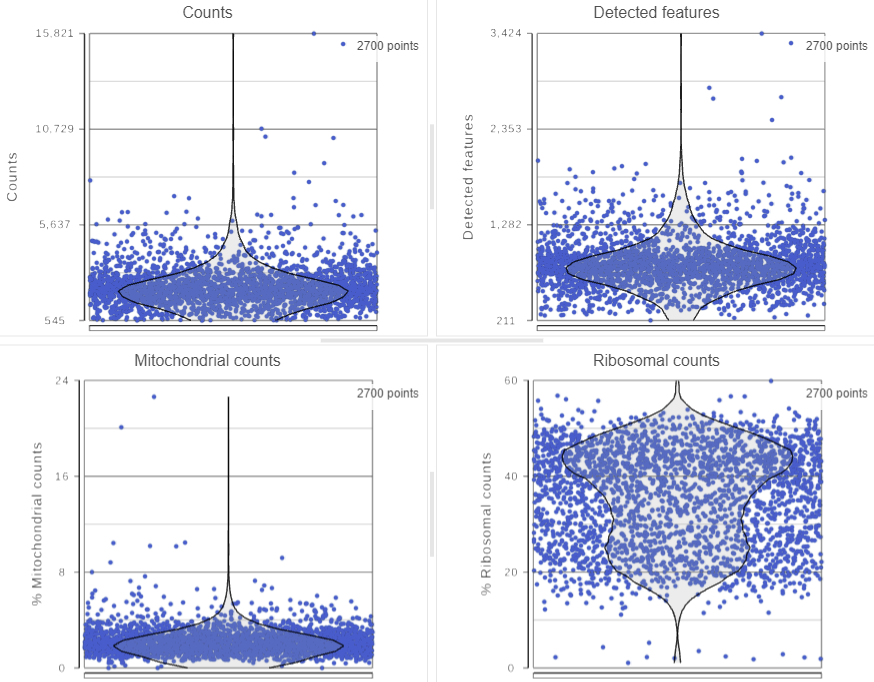
There are three plots: counts per cell, detected features per cell, and the percentage of mitochondrial counts per cell. If your cells do not express any mitochondrial genes or an appropriate annotation file was not specified, the plot for the percentage of mitochondrial counts per cell will be non-informative (Figure 3).
...
Mitochondrial genes are defined as genes located on a mitochondrial chromosome in the gene annotation file. The mitochondrial chromosome is identified in the gene annotation file by having "M" or "MT" in its chromosome name. If the gene annotation file does not follow this naming convention for the mitochondrial chromosome, Partek Flow will not be able to identify any mitochondrial genes. If your single cell RNA-Seq data was processed in another program and the count matrix was imported into Partek Flow, be sure that the annotation field that matches your feature IDs was chosen during import; Partek Flow will be unable to identify any mitochondrial genes if the gene symbols in the imported single cell data and the chosen gene/feature annotation do not match.
Ribosomal genes are defined as genes that code for proteins in the large and small ribosomal subunits. Ribosomal genes are identified by searching their gene symbol against a list of 89 L & S ribosomal genes taken from HGNC. The search is case-insensitive and includes all known gene name aliases from HGNC. Identifying ribosomal genes is performed independent of the gene annotation file specified.
Total counts are calculated as the sum of the counts for all features in each cell from the input data node. The number of detected features is calculated as the number of features in each cell with greater than zero counts. The percentage of mitochondrial counts is calculated as the sum of counts for known mitochondrial genes divided by the sum of counts for all features and multiplied by 100. The percentage of ribosomal counts are calculated as the sum of counts for known ribosomal genes divided by the sum of counts for all features and multiplied by 100.
Each point on the plots is a cell. All cells from all samples are shown on the plots. The overlaid violins illustrate the distribution of cell values for the y-axis metric.
...
Overview
Content Tools