Page History
...
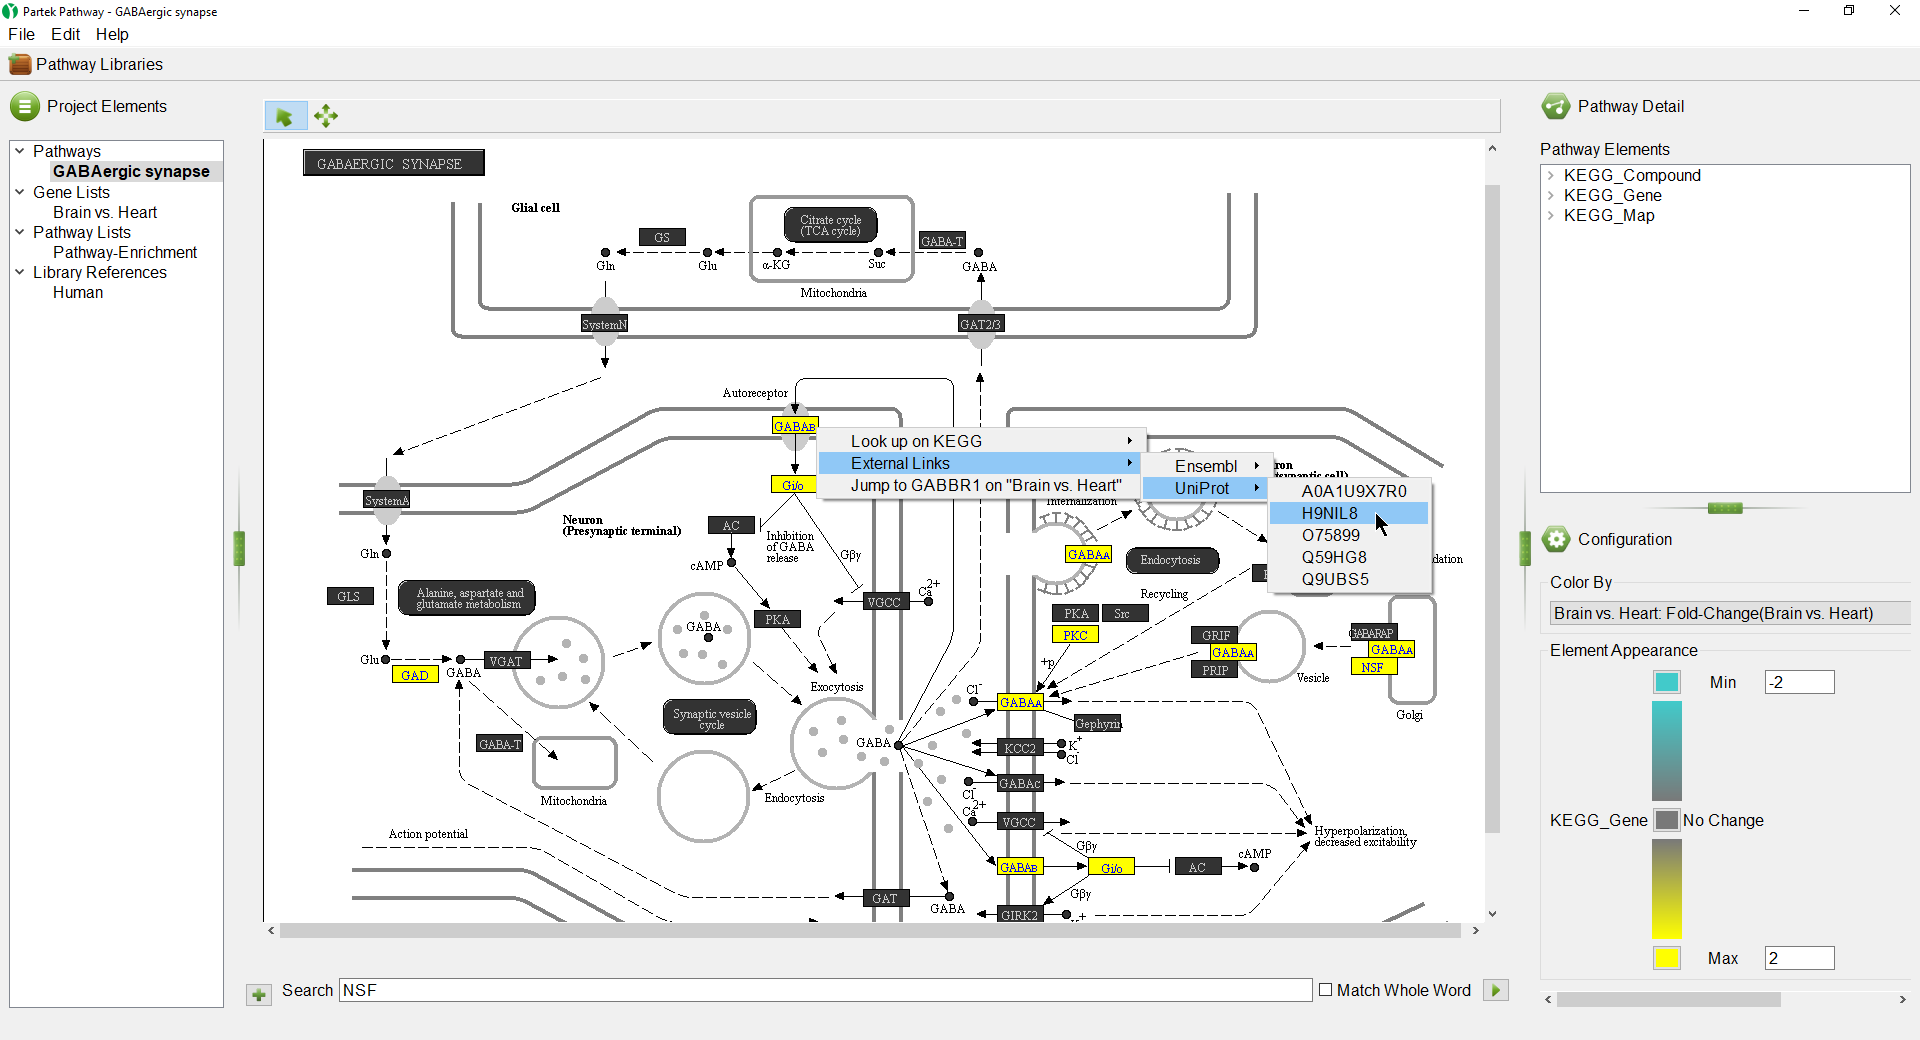
Any numerical column from the source gene list can be used to color the gene boxes. While significant p-values indicate a difference between the categories, they give no information about upregulation or downregulation of the pathway. We can overlay fold-change information on the pathway diagram.
- Select Brain vs. Heart: Fold-Change(Brain vs. Heart) from the drop-down menu
The pathway diagram now shows fold change for each gene in the pathway included in the gene list (Figure 6). Genes not in the gene list remain black.
...
| Numbered figure captions | ||||
|---|---|---|---|---|
| ||||
|
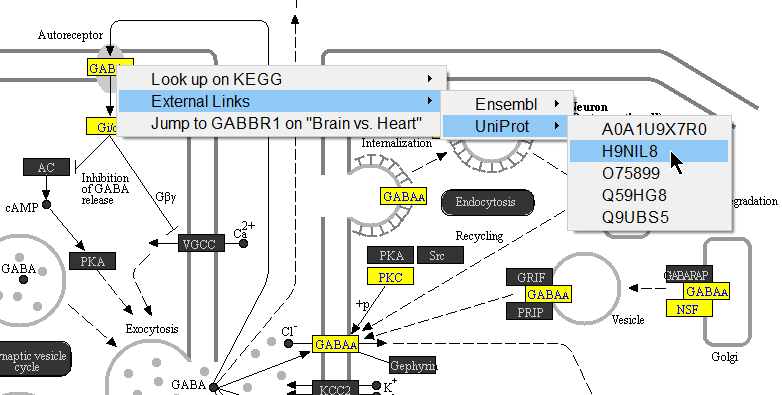
Opions available include:
...
- Select Adherens Junction
- Select View Pathway to open the pathway diagram
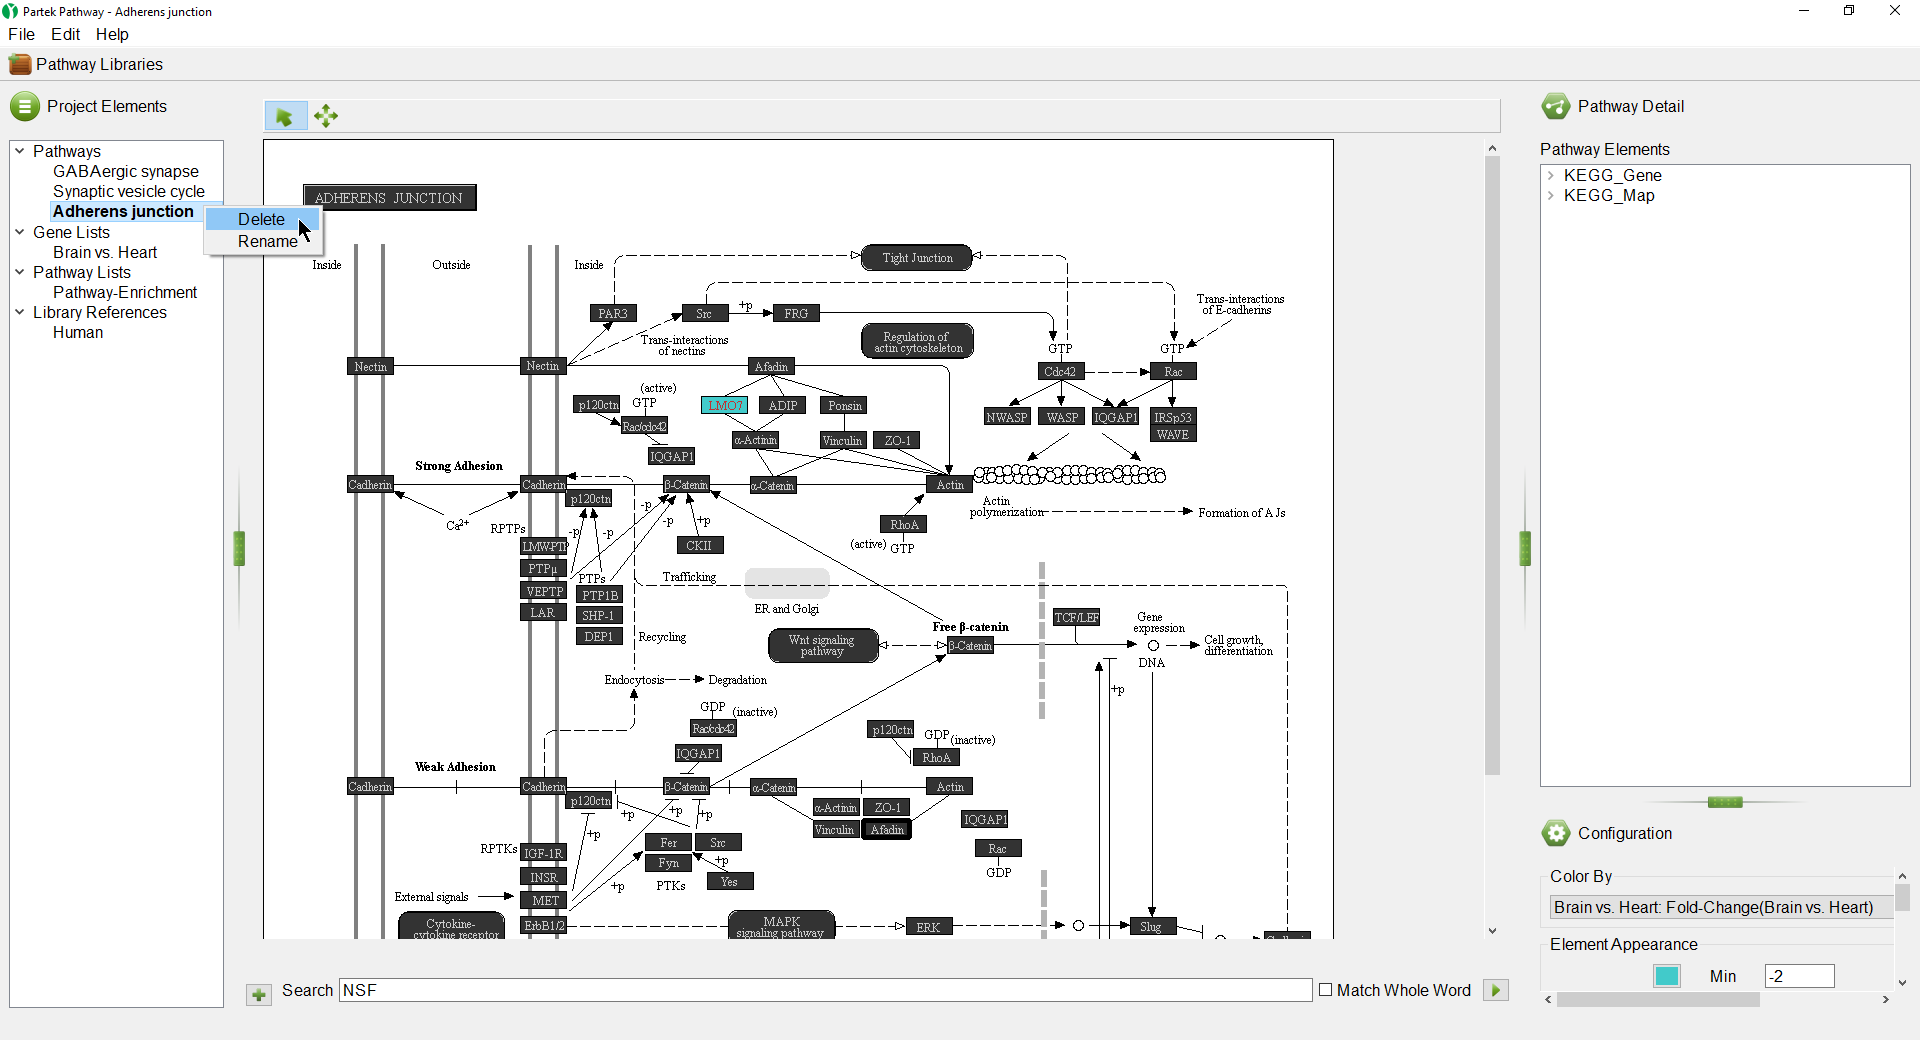
We can use the Project Elements panel to close an open pathway diagram or list.
- Right-click Adherens Junction in the Project Elements panel
- Select Delete from the pop-up menu to close the diagram (Figure 13)
| Numbered figure captions | ||||
|---|---|---|---|---|
| ||||
|
| Additional assistance |
|---|
| Rate Macro | ||
|---|---|---|
|
Overview
Content Tools