Page History
...
A convenient way to visualize the relationship between window size and gap size is to select the More info link at the top of the Peak Detection dialog box. A simulated read count histogram will open below the Description of Peak Detection section (Figure 2). The blue bars underneath the histogram will reflect how regions are detected and reported using your current Peak Detection settings. Try changing the How should windows be merged or Which regions should be reported? options to visualize their effects on peak detection.
| Numbered figure captions | ||||
|---|---|---|---|---|
| ||||
|
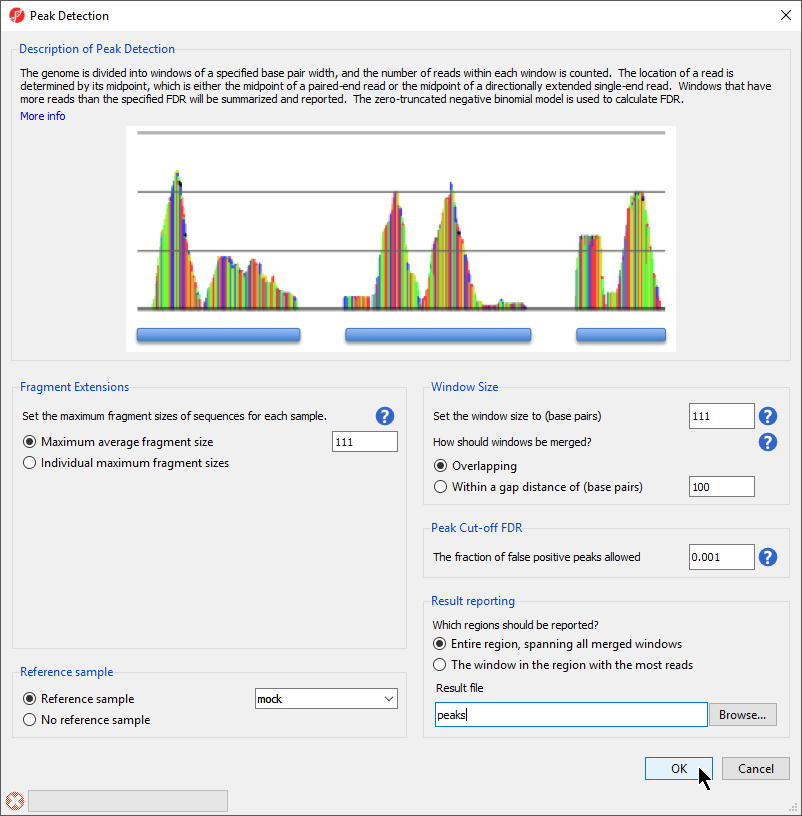
- Select OK to run the peak detection algorithm with your chosen settings
...
Overview
Content Tools