Page History
To detect differential methylation between CpG loci in different experimental groups, we can perform an ANOVA test. For this tutorial, we will perform a simple one-way ANOVA to compare naive-state hPSCs treated with shRNAs targeting NANOG to those targeting POU5F1the methylation states of the four experimental groups.
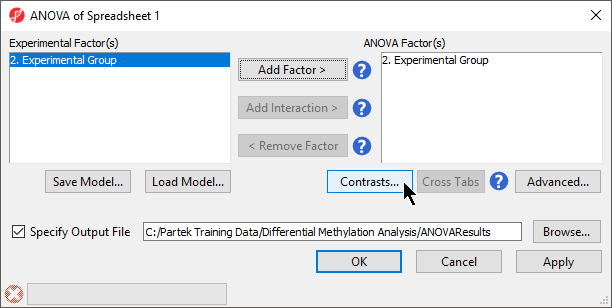
- Select Defect Differential Methylation from the Analysis section of the Illumina BeadArray Methylation workflow
- Select 3. shRNA treatment from the Experimental Factor(s) panel
- Select Add Factor > to move 3. shRNA treatment to the ANOVA Factor(s) panel (Figure 1)
| Numbered figure captions | ||||
|---|---|---|---|---|
| ||||
|
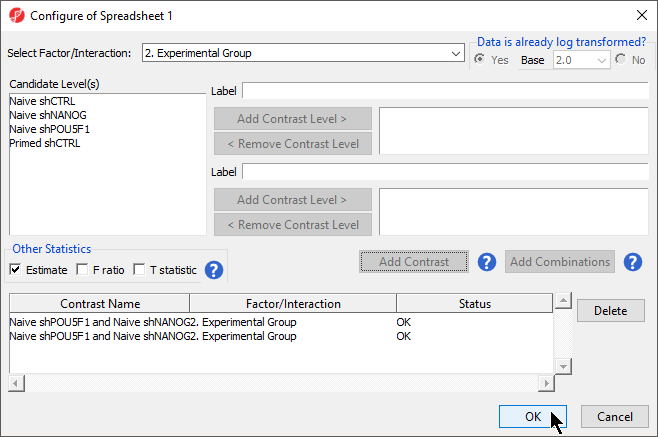
- Select Contrasts...
- Select Yes for Data is already log transformed? because M-values are based on logit transformation
- Select Naive shPOU5F1
- Select Add Contrast Level > for Group 1 to add shPOU5F1 to Group 1, which will be renamed shPOU5F1Repeat steps to add shNANOG to Group 2 for the upper group
- Repeat to add Naive shNANOG to the upper group
- Select Naive shCTRL
- Select Add Contrast Level > for the lower group
- Select Add Contrast
- Repeat steps to create an additional contrast: Naive shPOU5F1 and Naive shNANOG vs. Primed shCTRL
- Select the Estimate box in the Other Statistics section of the Configure dialog (Figure 2)
...
| Numbered figure captions | ||||
|---|---|---|---|---|
| ||||
|
- Select Add Combination
- Select OK to close the Configuration dialog
The Contrasts... button of the ANOVA dialog now reads Contrasts Included
- Select OK to close the ANOVA dialog and run the ANOVA
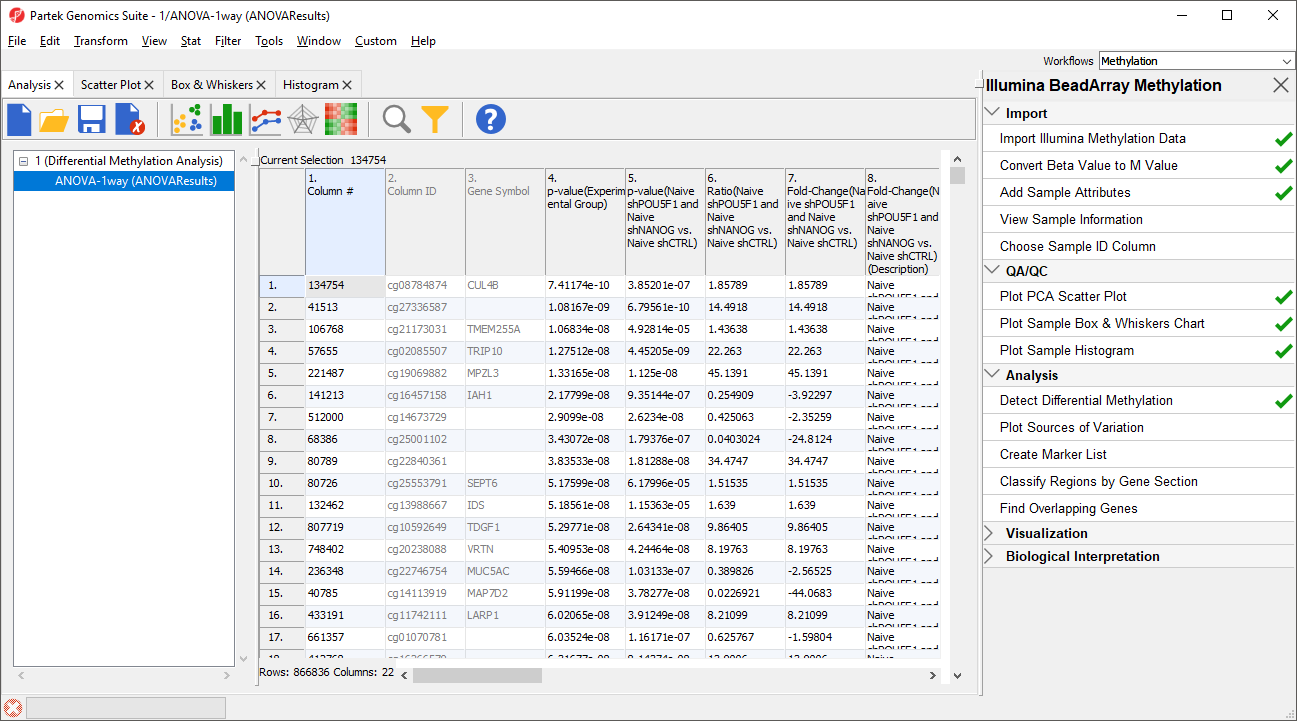
The results will appear as ANOVA-1way (ANOVAResults), a child spreadsheet of 1 (Differential Methylation Analysis). Each row of the spreadsheet represents a single CpG locus (identified by Column ID).
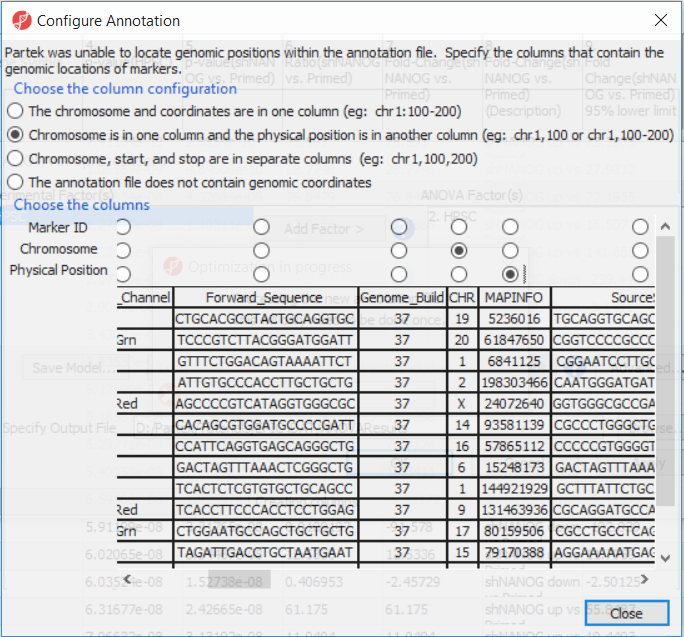
The first time you use MethylationEPIC arrayIf this is the first time you have analyzed a MethylationEPIC array using the Partek Genomics Suite software, the manifest file needs may need to be configured and the window like the one in Figure 4 will pop up. First select the second option (. If it needs configuration, the Configure Annotation dialog will appear (Figure 3).
- Select Chromosome is in one column and the physical location is in another column
...
- for Choose the column configuration
- Select Ilmn ID for Marker ID
- Select CHR for Chromosome i
- Select MAPINFO for Physical Position
- Select Close
Select Close. This enable Partek Genomics Suite to parse out probe annotation from the manifest file.
| Numbered figure captions | ||||
|---|---|---|---|---|
| ||||
|
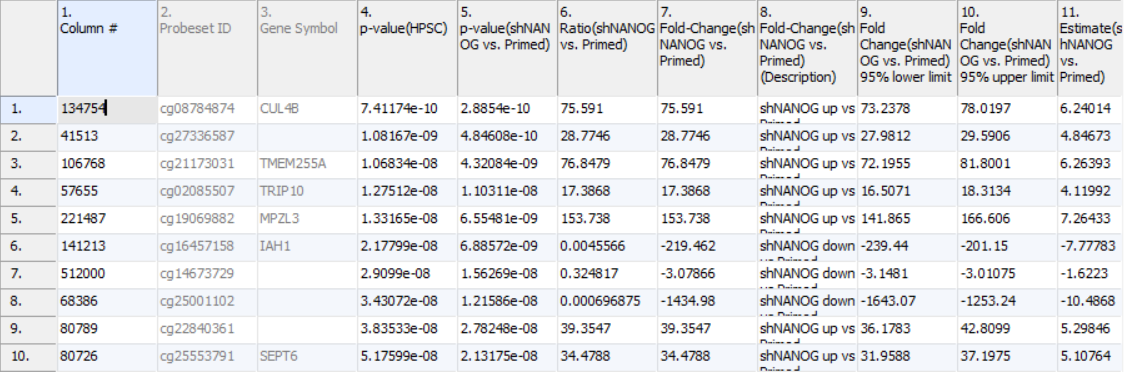
Column 3. Gene Symbol: the gene overlapping the probe as specified in the Illumina manifest file
Column 4. p-value(HPSC): overall p-value for the specified factor (in parenthesis). A low p-value indicates that there is a difference in methylation between the levels of this attribute (i.e. study groups). The contrast p-values should then be used to evaluate individual group comparisons. If more than one factor is included in the model, p-value will be reported for each.
Next, for each contrast included in the model, a block of seven columns will be added, as follows:
Column 5. p-value(shNANOG vs. Primed): p-value for the given contrast (in parenthesis). A low p-value indicates a difference in methylation between the groups included in the contrast (here: shNANOG and Primed).
Column 6. Ratio(shNANOG vs. Primed): ratio of average methylation level in one over the other the other contrasted group (shNANOG and Primed, respectively). Ratio is reported in linear space.
Column 7. Fold Change(shNANOG vs. Primed): fold-change in one over the other contrasted group (shNANOG and Primed, respectively). Fold-change is reported in linear space.
Column 8. Fold Change(shNANOG vs. Primed) (Description): if fold-change > 1, it means hypermethylation in the first group (e.g. shNANOG up vs Primed), if fold-change < -1, it means hypomethylation in the first group (e.g. shNANOG down vs Primed), relative to the second group (Primed). This column enables quick filtering
Columns 9. & 10. Lower and upper (respectively) limits of 95% confidence interval of the fold-change
Column 11. Estimate(shNANOG vs. Primed): difference between means of two groups (i.e. shNANOG and Primed) (this column is optional and depends on the way contrasts were set up)
Columns 12. - 18. correspond to columns 5. - 11.
Columns 19.+ Statistical output
| Numbered figure captions | ||||
|---|---|---|---|---|
| ||||
|
Going forward, analysis of differentially methylated loci typically includes removal of the probes on X and Y chromosomes (to avoid the problems with inactivation of one X chromosome). To annotate the ANOVA spreadsheet with the information required for filtering, right-click on the Gene Symbol column, select Insert Annotation, tick-mark the CHR filed (Figure 6) and push OK. A new column will be appended to the spreadsheet.
...
Overview
Content Tools