Page History
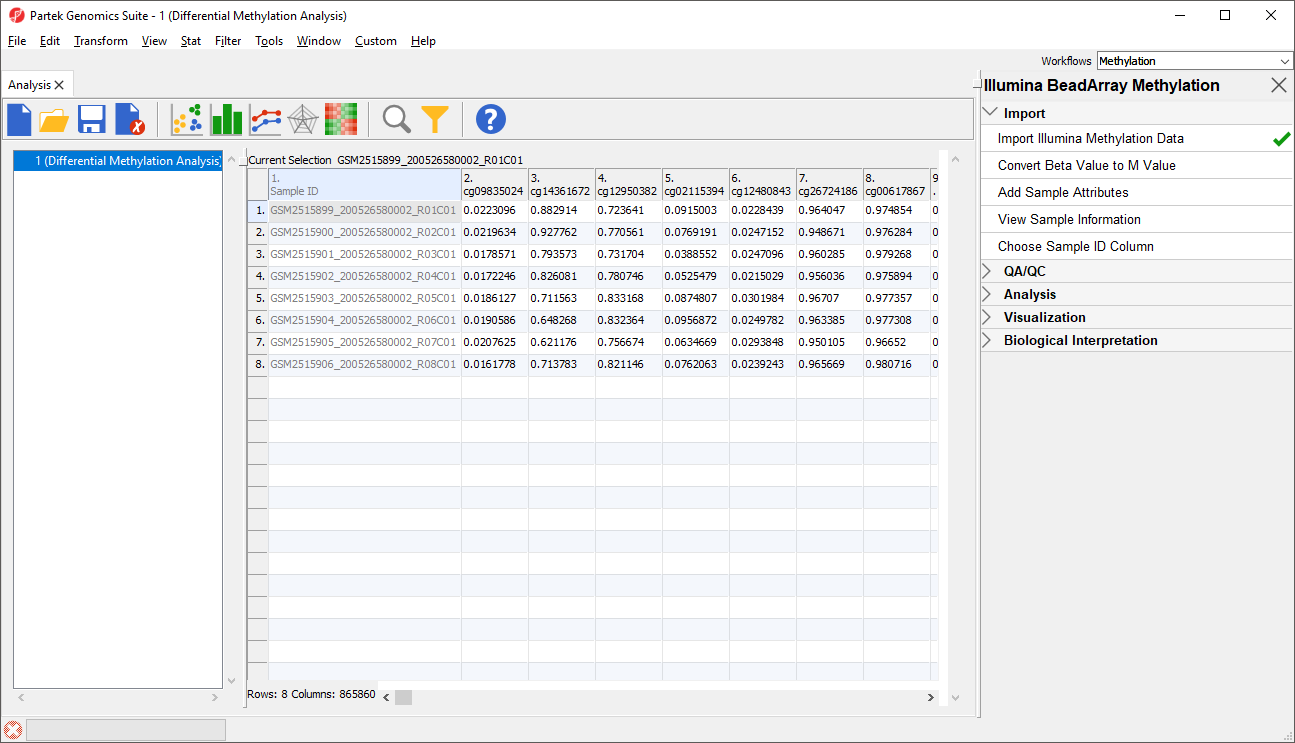
Each row of the spreadsheet (Figure 1) corresponds to a single sample. The first column is the names of the .idat files and the remaining columns are the array probes. The table values are β-values, which correspond to the percentage methylation at each site. A β-value is calculated as the ratio of methylated probe intensity over the overall intensity at each site (the overall intensity is the sum of methylated and unmethylated probe intensities).
| Numbered figure captions | ||||
|---|---|---|---|---|
| ||||
|
...
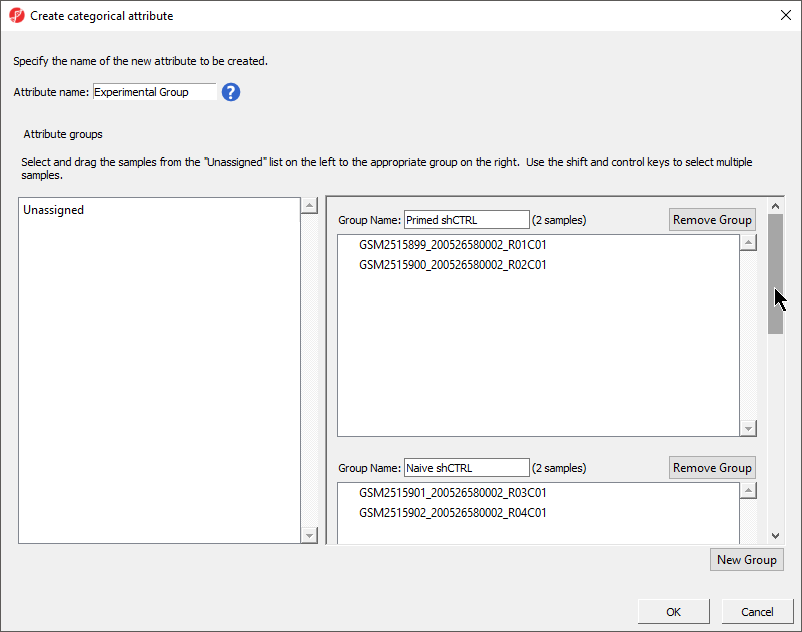
The Create categorical attribute dialog (Figure 3) allows us to create groups for a categorical attribute. By default, two groups are created, but additional groups can be added.
| Numbered figure captions | ||||
|---|---|---|---|---|
| ||||
|
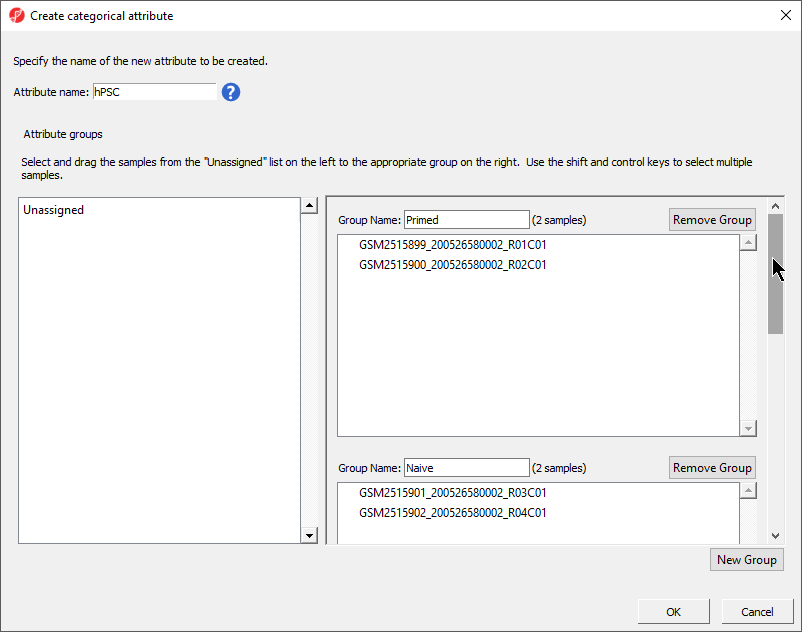
- Select New Group twice to add two additional groups
- Set Attribute name: to hPSC
- Rename the four groups Primed, Naive, shPOU5F1, and shNANOG
- Drag and drop the samples from the Unassigned list to their groups as listed in the table below
...
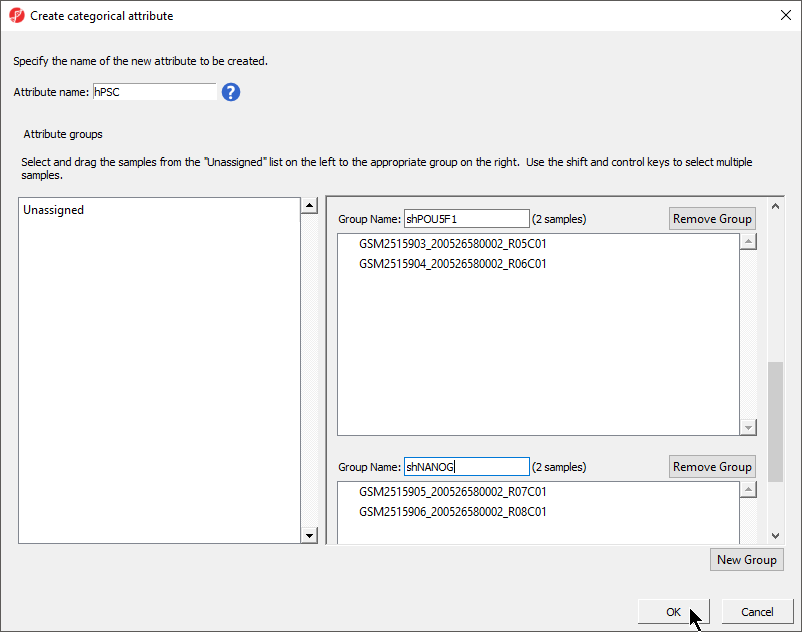
There should now be four groups with two samples in each group (Figure 4).
| Numbered figure captions | ||||
|---|---|---|---|---|
| ||||
|
...
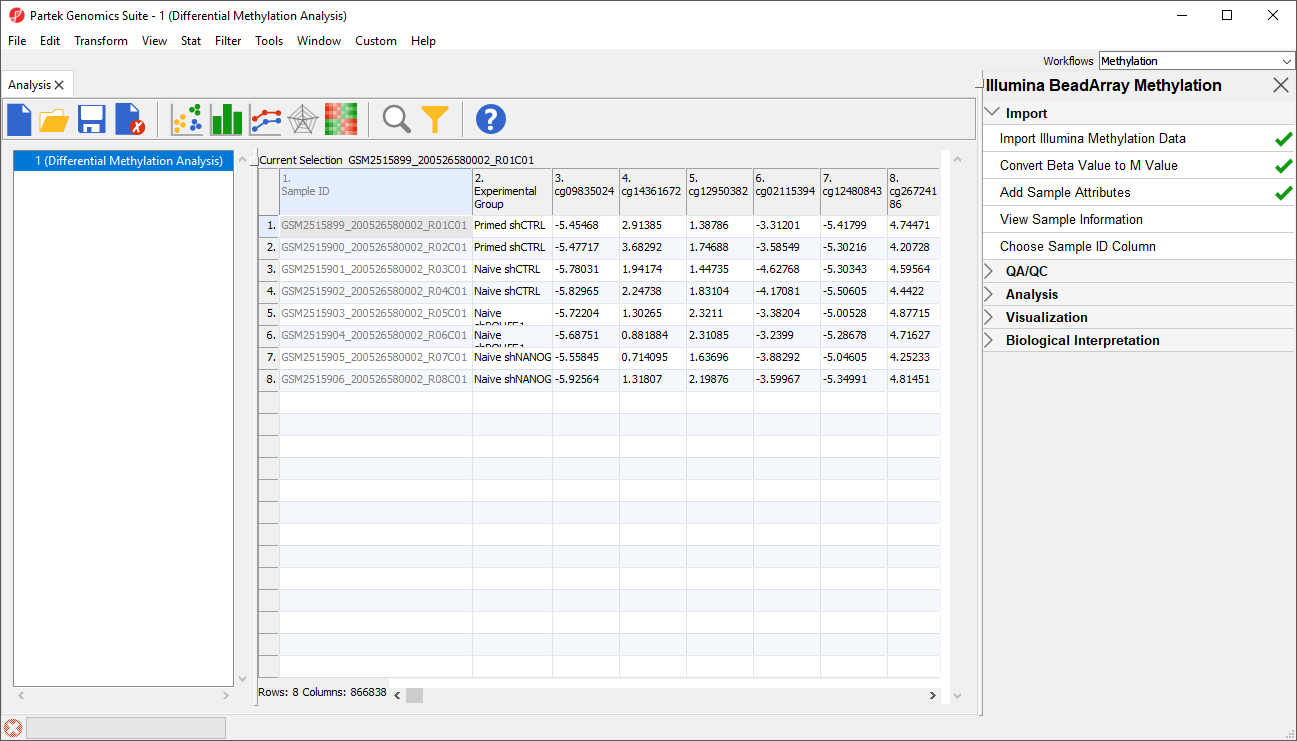
A new column as been added to spreadsheet 1 (Differential Methylation Analysis) with the experimental group of each sample (Figure 5).
| Numbered figure captions | ||||
|---|---|---|---|---|
| ||||
|
| Page Turner | ||
|---|---|---|
|
...
Overview
Content Tools