Opening a gene list as a child spreadsheet
Gene lists can be visualized and their ability to distinguish samples evaluated using a hierarchical clustering heat map. Because of the batch effect in this data set, we will perform hierarchical clustering using batch-corrected intensity values. To do this, we need to open the fourtreatments list of differentially expressed genes as a child spreadsheet of the batch-remove spreadsheet
- Select fourtreatments from the spreadsheet tree
- Select (
 ) to close the spreadsheet
 - Select 1-removeresult (batch-remove) from the spreadsheet tree
- Select File from the main tool bar
- Select Open as child...
- Select fourtreatments using the file browser
The fourtreatments spreadsheet will open as a child spreadsheet of batch-remove (Figure 1).
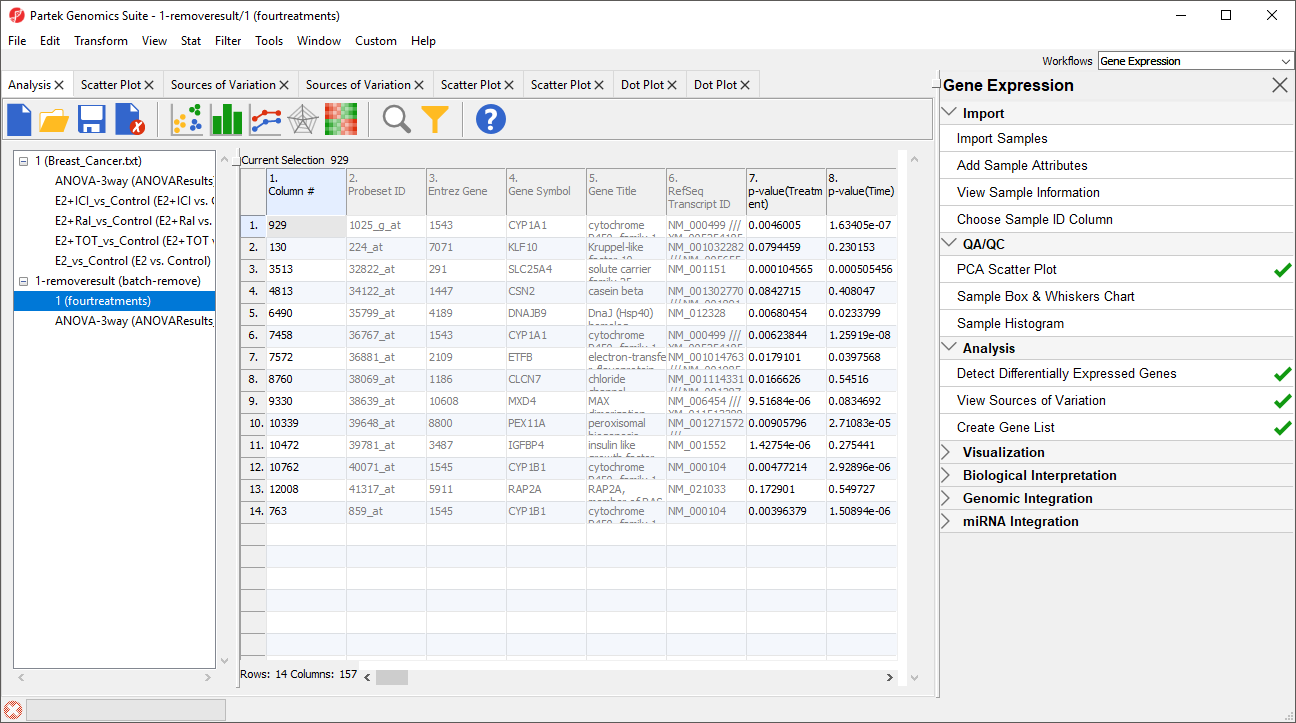
Figure 1. The fourtreatments spreadsheet is open as a child spreadsheet of bath-remove. Visualizations performed using fourtreatments will pull intensity values from batch-remove.
Visualizations performed using the fourtreatments spreadsheet will now use intensity values from the batch-remove spreadsheet.
Hierarchical clustering using a gene list
To invoke hierarchical clustering, follow the steps below.
- Select Cluster Based on Significant Genes from the Visualization section of the Gene Expression workflow
- Select Hierarchical Clustering
- Select OK
- Select 1-removeresult/1 (fourtreatments) from the drop-down menu
- Select Standardize for Expression normalization (Figure 2)
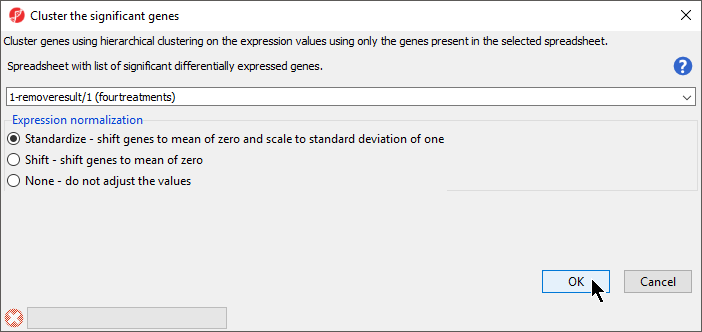
Figure 2. Configuring the Cluster the significant genes dialog
- Select OK
The hiearchical clustering heat map will open in a new tab (Figure 3).
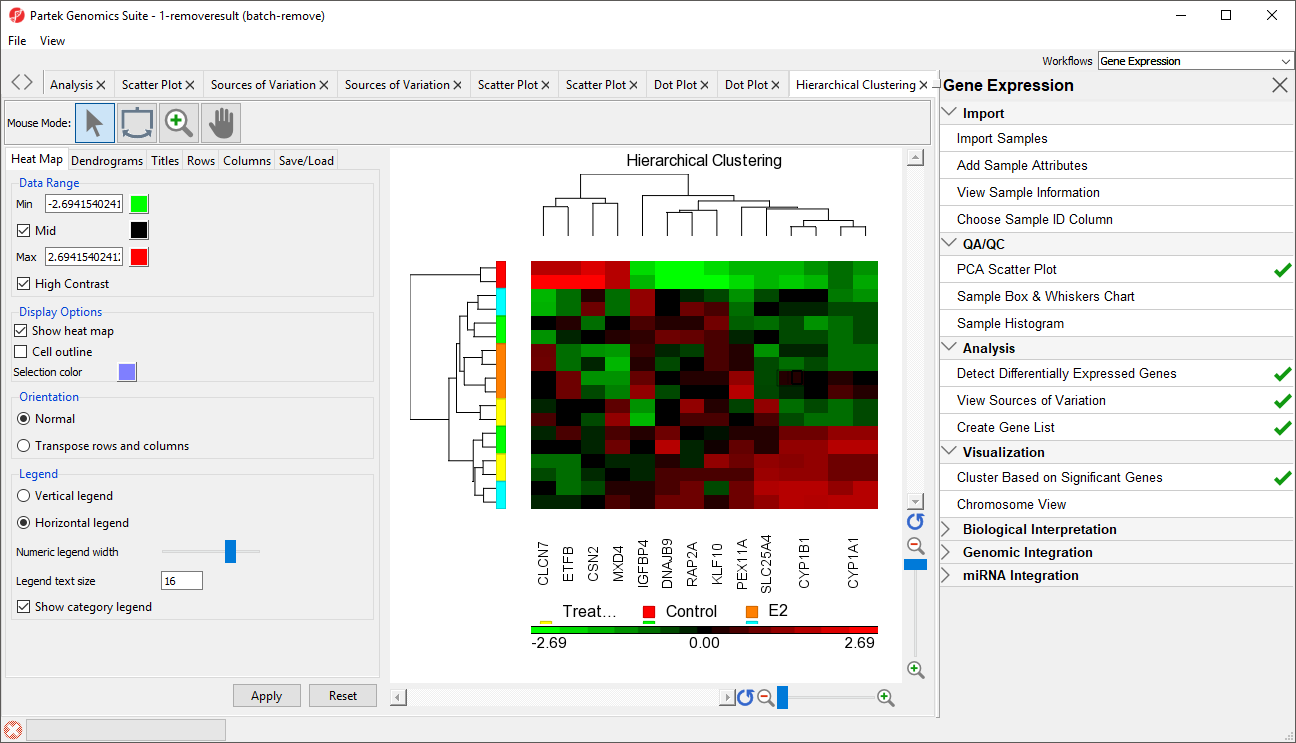
Figure 3. Hierarchical clustering of genes with significantly different expression across the treatment groups
Genes without changes in expression are given a value of zero and are colored black. Up-regulated genes have positive values and are displayed in red. Down-regulated genes have negative values and are displayed in green. Each sample is represented in a row while genes are represented as columns. Dendrograms illustrate clustering of samples and genes. To learn more about configuring the hierarchical clustering heat map, see the Hierarchical Clustering Analysis user guide.
For detailed information about the methods used for clustering, refer to the Partek Manual Chapter 8: Hierarchical & Partitioning Clustering.
Additional Assistance
If you need additional assistance, please visit our support page to submit a help ticket or find phone numbers for regional support.


| Your Rating: |
|
Results: |

|
44 | rates |
Overview
Content Tools