Introducing Cox Regression
Cox regression (Cox proportional-hazards model) tests the effects of several factors (predictors) on survival time. Predictors that lower the probability of survival at a given time are called risk factors; predictors that increase the probability of survival at a given time are called protective factors. The Cox proportional-hazards model are similar to a multiple logistic regression that considers time-to-event rather than simply whether an event occurred or not.
In this tutorial, we will use Cox Regression to test the effects of tumor gene expression on survival time while accounting for tumor size.
Performing Cox Regression Analysis
To begin, you should have the Survival Tutorial data set open in Partek Genomics Suite as shown.
- Select Stat from the main toolbar
- Select Survival Analysis then Cox Regression from the Stat menu (Figure 1)
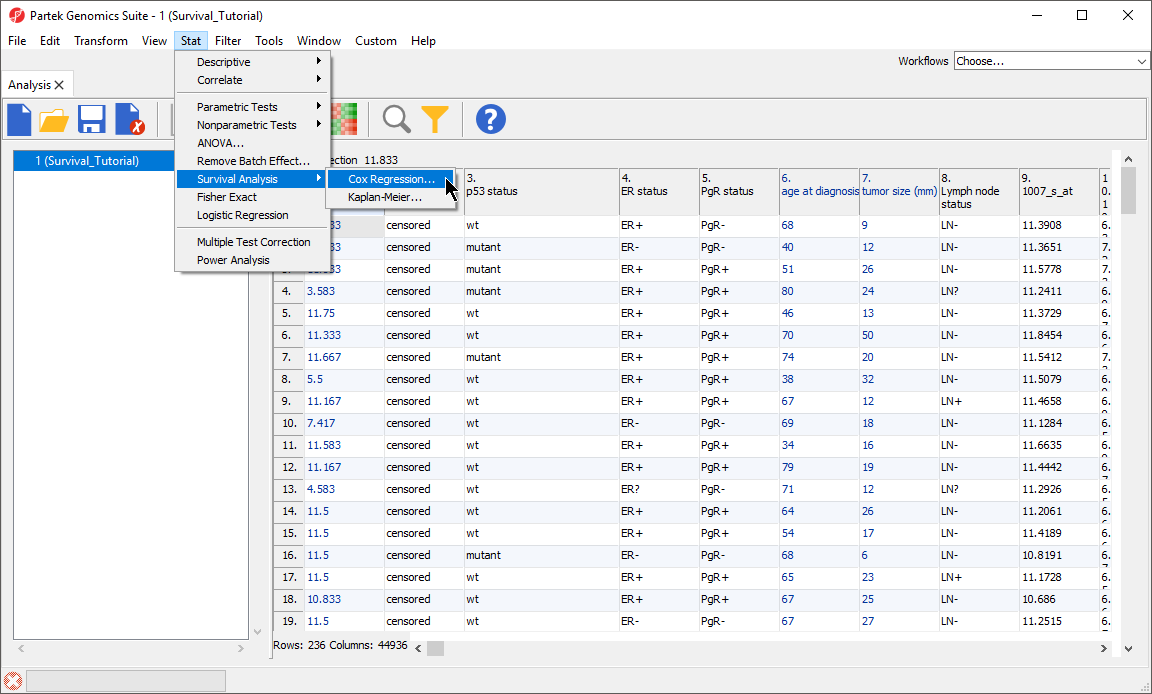
Figure 1. Invoking Cox Regression
The Cox Regression dialog will open. Please note that in this tutorial data set, column 1. Survival (years) indicates the survival time of each patient in years and column 2. Event indicates the event status for each patient, death or censored.
- Set Time Variable to 1. Survival (years) using the drop-down menu
- Set Event Variable to 2. Event using the drop-down menu
Only numeric data are displayed in the Time Variable drop-down list and only categorical data with two categories are displayed in Event Variable.
- Set Event Status to death using the drop-down menu (Figure 2)
Event Status should be set to the primary event outcome. All Response Variables will be automatically selected for Predictor. This means that Cox Regression will test every probe set for association with the survival (time-to-event).
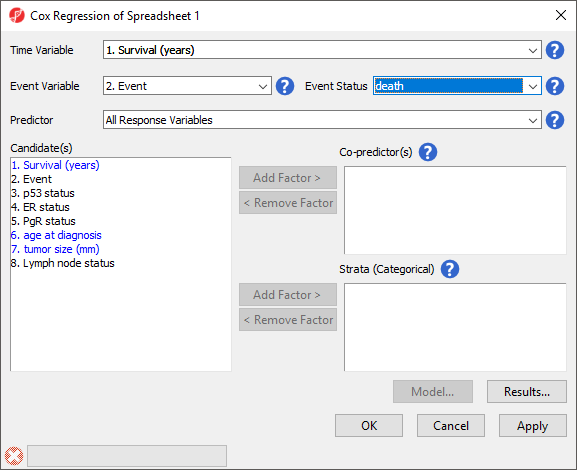
Figure 2. Configuring the Cox Regression dialog
Co-predictors are numeric or categorical factors that will be included in the regression model. To evaluate the association between tumor size and gene expression, we can add tumor size to the co-predictors list.
- Select 7. tumor size (mm) from the Candidate(s) panel
- Select Add Factor > to add it to the Co-predictor(s) panel
Advanced options such as the inclusion of interactions between predictors and co-predictors can be accessed by selecting Model... (Figure 3) and the Results... button invokes a dialog (Figure 4) with additional output options for the results spreadsheet. We do not need to adjust any of the advanced model or output options for this tutorial.
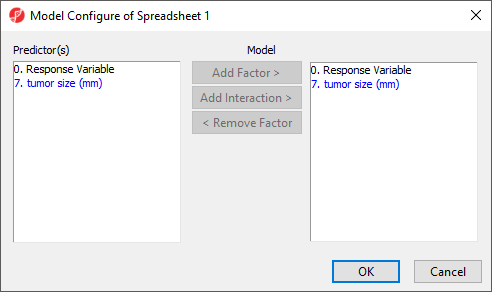
Figure 3. Configuring advanced options for Cox Regression
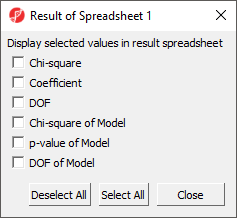
Figure 4. Configuring output options for Cox Regression
- Select OK to run Cox Regression (Figure 5)
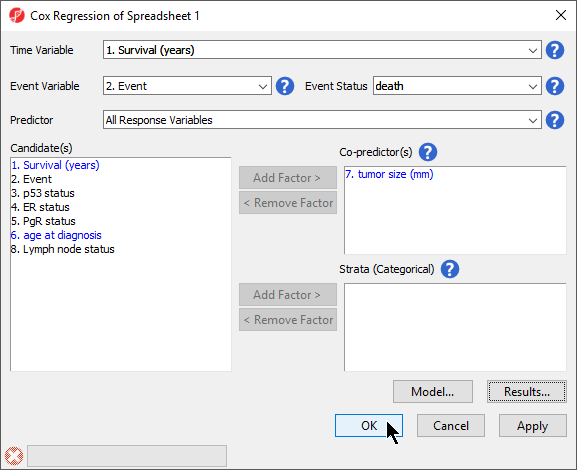
Figure 5. Configuring Cox Regression to assess the effect of gene expression and tumor size on survival
The spreadsheet generated by Cox Regression (Figure 6) includes a row for each probe set; the columns provide the following information:
1. Column # - Column number of probe set in probe intensities spreadsheet
2. Probest ID - ID of probe set in probe intensities spreadsheet
3. HRatio(gene) - Hazard ratio for the probe set
4. LowCI(gene) - lower 95% confidence boundary of the hazard ratio for the probe set
5. UpCI(gene) - upper 95% confidence boundary of the hazard ratio for the probe set
6. p-value(gene) - P-value of the corresponding Chi-squared test. A low value indicates that the predictor (probe set) poses a large hazard or is associated with shortened surivival time
7. to 10. - Effects of the co-predictor on survival time; for each co-predictor, a similar set of columns is added
11. modelfit(0) - P-value of the test assessing the overall model fit, i.e., the relationship between survival time, the predictor, and co-predictors in the model. A modelfit value of > 0.05 indicates a low association between the predictor and/or co-predictors with survival time.
Please note that the Cox Regression results spreadsheet is a temporary file. If you would like to be able to view the spreadsheet again after closing Partek Genomics Suite, be sure to save it by selecting the Save Active Spreadsheet icon (![]() ).
).
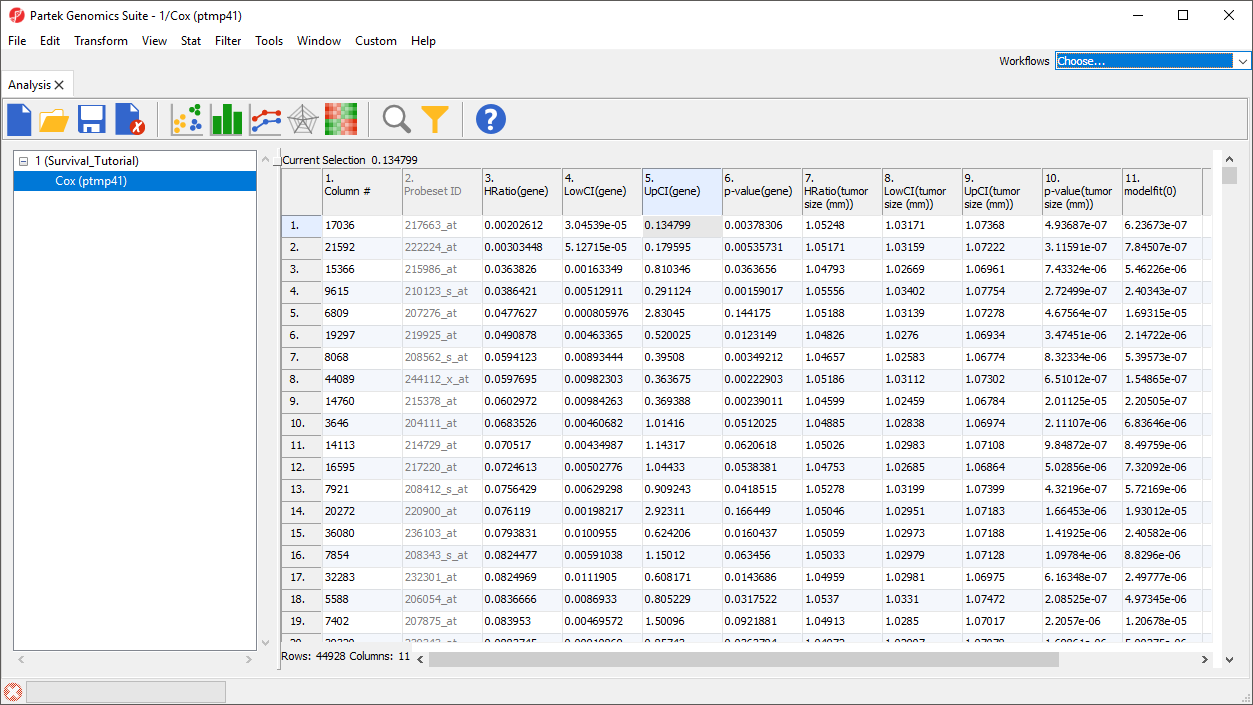
Figure 6. Cox Regression results spreadsheet
The hazard ratio is an effect size measure used to assess the direction and magnitude of the effect of a predictor variable on the relative likelihood of the event occurring at any given point in time, controlling for other predictors in the model.
For continuous predictors, such as gene expression values and tumor size, the hazard ratio is the predicted change in the hazard for a unit increase in the predictor. A hazard ratio greater than 1 indicates that the predictor is associated with shorter time-to-event, hazard ratio less than 1 indicates that the predictor is associated with greater time-to-event, and a hazard ratio of 1 indicates that the predictor has no effect on time-to-event. For categorical predictors, the hazard ratio is relative to the reference category.
For any probe set, we can view a detailed HTML report.
- Right-click the row header for row 1
- Select HTML Report from the pop-up menu (Figure 7)
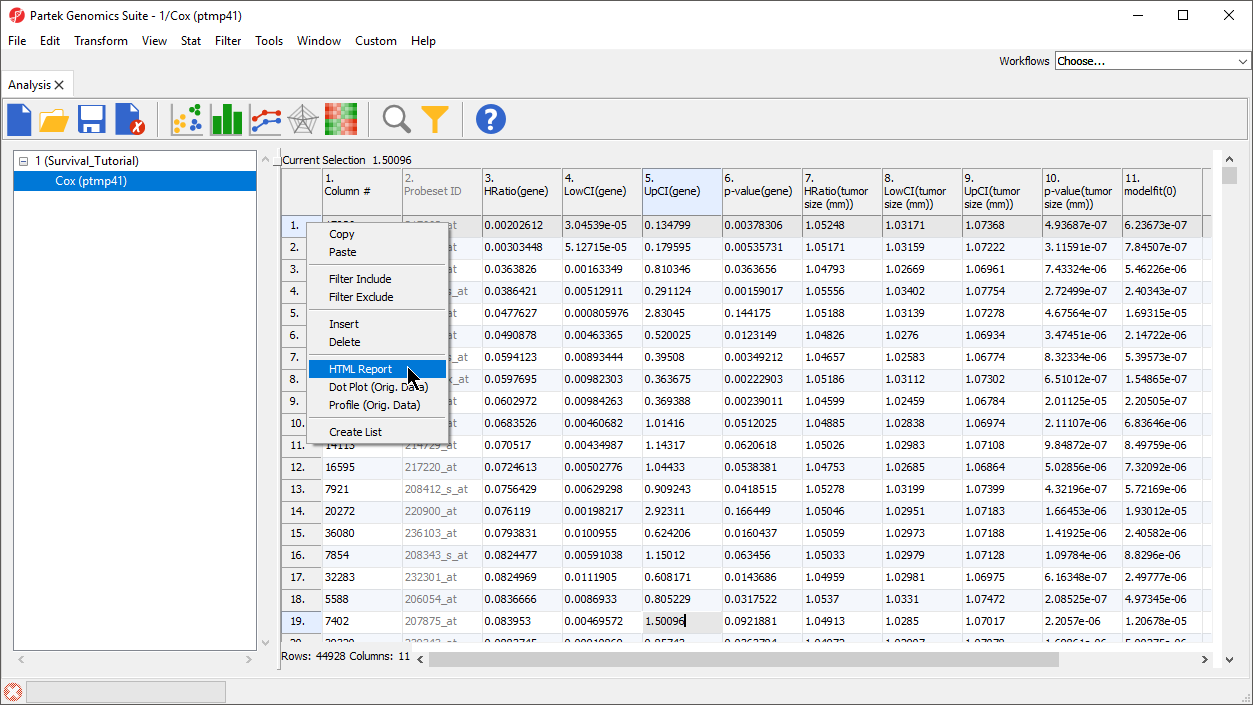
Figure 7. Invoking an HTML report for a probe set
The HTML report (Figure 8) will open in your default web browser.
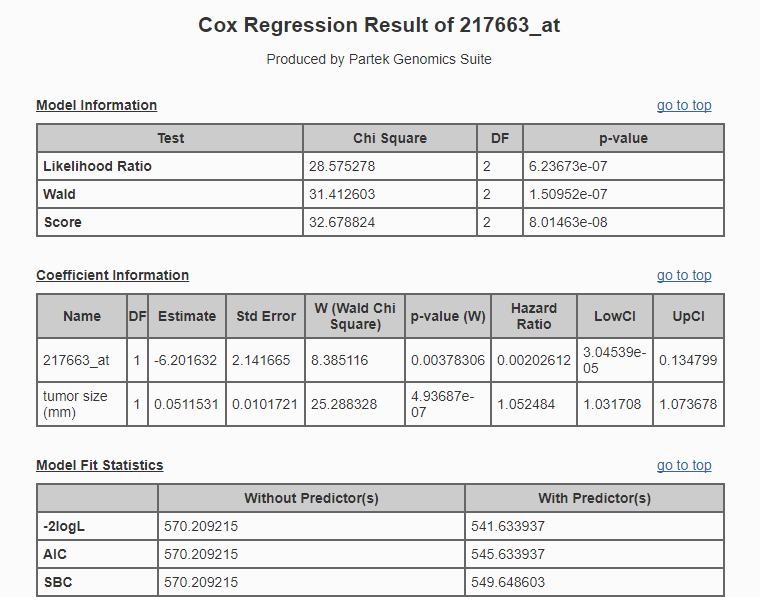
Figure 8. Cox Regression HTML report
Additional Assistance
If you need additional assistance, please visit our support page to submit a help ticket or find phone numbers for regional support.


| Your Rating: |
|
Results: |

|
34 | rates |
Overview
Content Tools