Validate variants is available for data nodes containing variants (Variants, Filtered variants, or Annotated Variants). The purpose of this task is to understand the performance of the variant calling pipeline by comparing variant calls from a sample within the project to known “gold standard” variant data that already exist for that sample. This “gold standard” data can encompass variants identified with high confidence by other experimental or computational approaches.
Setting up the task (Figure 1) involves identifying the Genome Build used for variant detection and the Sample to validate within the project. Target specific regions allows for specification of the Target regions for this study, relating to the regions sequenced for all samples in the project. Benchmark target regions represents the regions that have been previously interrogated to identify “gold standard” variant calls in the sample of interest. These parameters are important to ensure that only overlapping regions are compared, avoiding the identification of false positives or false negative variants in regions covered by only the project sample or the “gold standard” sample. Both sections utilize a Gene/feature annotation file, which can be previously associated with Partek Flow via Library File Management or added on the fly. The Validated variants file is a single sample vcf file containing the “gold standard” variant calls for the sample of interest, and can be previously associated with Partek Flow as a Variant Annotation Database via Library File Management or added on the fly.
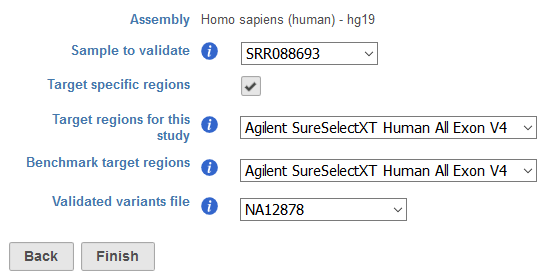
Figure 1. Task dialog for Validate variants
The Validate variants results page contains statistics related to the comparison of variants in the project sample compared to the validated variant calls for the sample (Figure 2). The results are split in to two sections, one based on metrics calculated from the comparison of SNVs and the other from the comparison of INDELs.
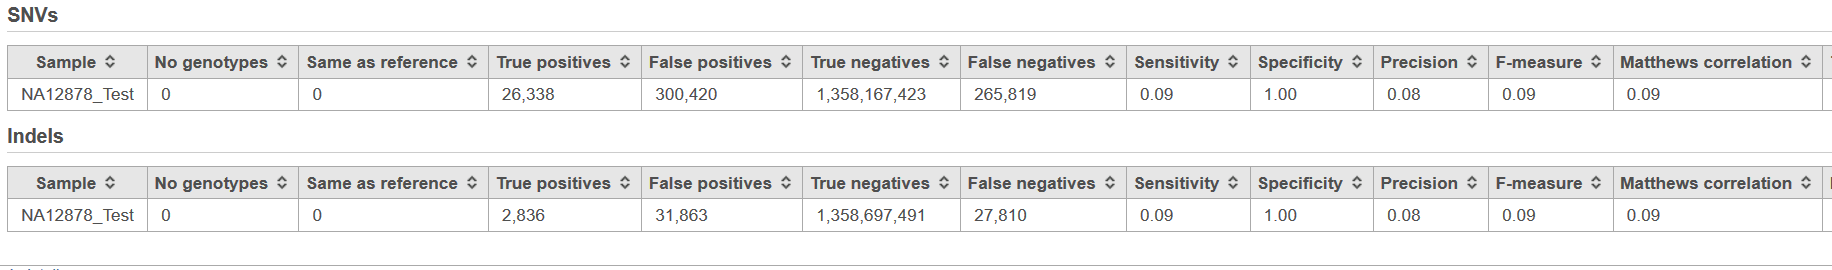
Figure 2. Example of the Variant validation report, with analysis at the level of both SNVs and INDELs. Note that the table is truncated due to the number of columns.
The following SNP-level metrics are contained within the report, comparing the sample in the project to the validated variant data:
- No genotypes: the number of missing genotypes from the sample in the Flow project
- Same as reference: the number of homozygous reference genotypes from the sample in the Flow project
- True positives: the number of variant genotypes from the sample in the Flow project that match the validated variants file
- False positives: the number of variant genotypes from the sample in the Flow project that are not found in the validated variants file
- True negatives: the number of loci that do not have variant genotypes in the sample in the Flow project and the validated variants file
- False negatives: the number of genotypes that do not have variant genotypes in the sample in the Flow project but do have variant genotypes in the validated variants file
- Sensitivity: the proportiion of variant genotypes in the validated variants file that are correctly identified in the sample in the Flow project (true positive rate)
- Specificity: the proportion of non-variant loci in the validated variants file that are non-variant in the sample in the Flow project (true negative rate)
- Precision: the number of true positive calls divided by the number of all variant genotypes called in the the sample in the Flow project (positive predictive value),
- F-measure: a measure of the accuracy of the calling in the Flow pipeline relative to the validated variants.It considers both the precision and the recall of the test to compute the score. The best value at 1 (perfect precision and recall) and worst at 0.
- Matthews correlation: a measure of the quality of classification, taking into account true and false positives and negatives. The Matthews correlation is a correlation coefficient between the observed and predicted classifications, ranging from −1 and +1. A coefficient of +1 represents a perfect prediction, 0 no better than random prediction and −1 indicates completely wrong prediction.
- Transitions: variant allele interchanges of purines or pyrimidines in the sample in the Flow project relative to the reference
- Transversions: variant allele interchanges of purines to/from pyrimidines in the sample in the Flow project relative to the reference
- Ti/Tv ratio: ratio of transition to transverstions in the sample in the Flow project
- Heterozygous/Homozygous ratio: the ratio of heterzyous and homozgous genotypes in the sample in the Flow project
- Percentage of sites with depth < 5: the percentage of variant genotypes in the sample in the Flow project that have fewer than 5 supporting reads
- Depth, 5th percentile: 5% of sequencing depth found across all variant genotypes in the sample in the Flow project
- Depth, 50th percentile: 50% of sequencing depth found across all variant genotypes in the sample in the Flow project
- Depth, 95th percentile: 95% of sequencing depth found across all variant genotypes in the sample in the Flow project
The INDEL-level metrics columns contained within the report are identical, with the expeption of a lack of information with regards to transitions and transversion.
Additional Assistance
If you need additional assistance, please visit our support page to submit a help ticket or find phone numbers for regional support.


| Your Rating: |
|
Results: |

|
36 | rates |
Overview
Content Tools