To analyze scATAC-seq data, Partek Flow introduced a new technique - LSI (latent semantic indexing )[1]. LSI combines steps of frequency-inverse document frequency (TF-IDF) normalization followed by singular value decomposition (SVD). This returns a reduced dimension representation of a matrix. Although SVD and Principal components analysis (PCA) are two different techniques, the SVD has a close connection to PCA. Because PCA is simply an application of the SVD. For users who are more familiar with scRNA-seq, you can think of SVD as analogous to the output of PCA. And similarly, the statistical interpretation of singular values is in the form of variance in the data explained by the various components. The singular values produced by the SVD are in order from largest to smallest and when squared are proportional the amount of variance explained by a given singular vector.
SVD task in Flow can be invoked in Exploratory analysis section by clicking any single cell counts data node (Figure 1). We recommend running SVD on the normalized data, particularly the TF-IDF normalized counts for scATAC-seq analysis.
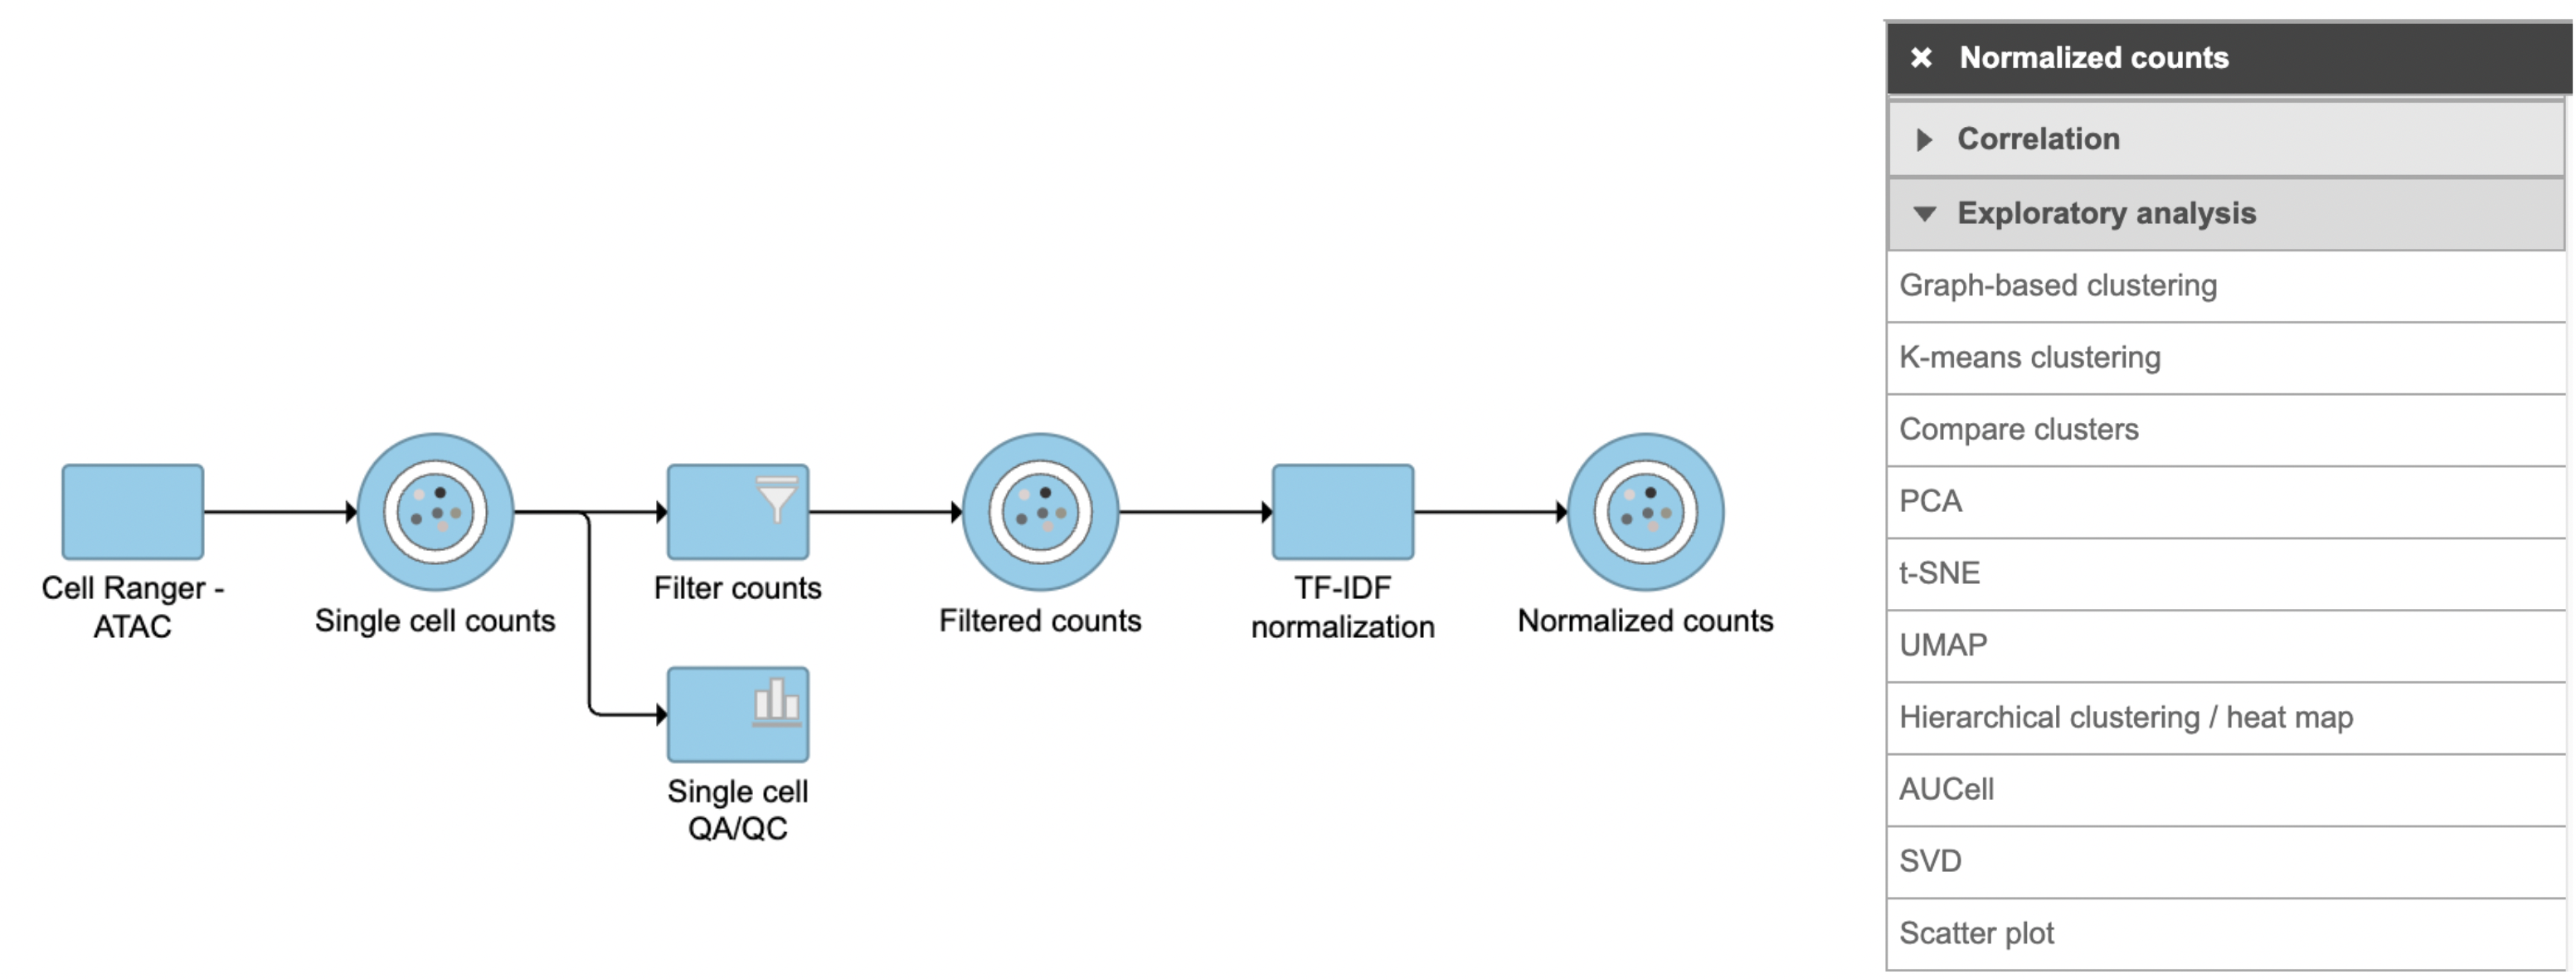
Figure 1. SVD task in Flow
To run SVD task,
- Click a single cell counts data node
- Click the Exploratory analysis section in the toolbox
- Click SVD
The GUI is simple and easy to understand. The SVD dialog is only asking to select the number of singular values to compute (Figure 2). By default 100 singular values will be computed if users don't want to compute all of them. However, the number could be adjusted manually or typed in directly. Simply click the Finish button if you want to run the task as default.
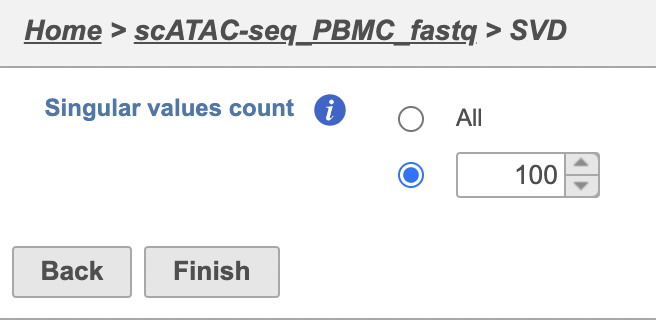
Figure 2. Interface of SVD task in Partek Flow.
The task report for SVD is similar to PCA. Its output will be used for downstream analysis and visualization, including Harmony (Figure 3).
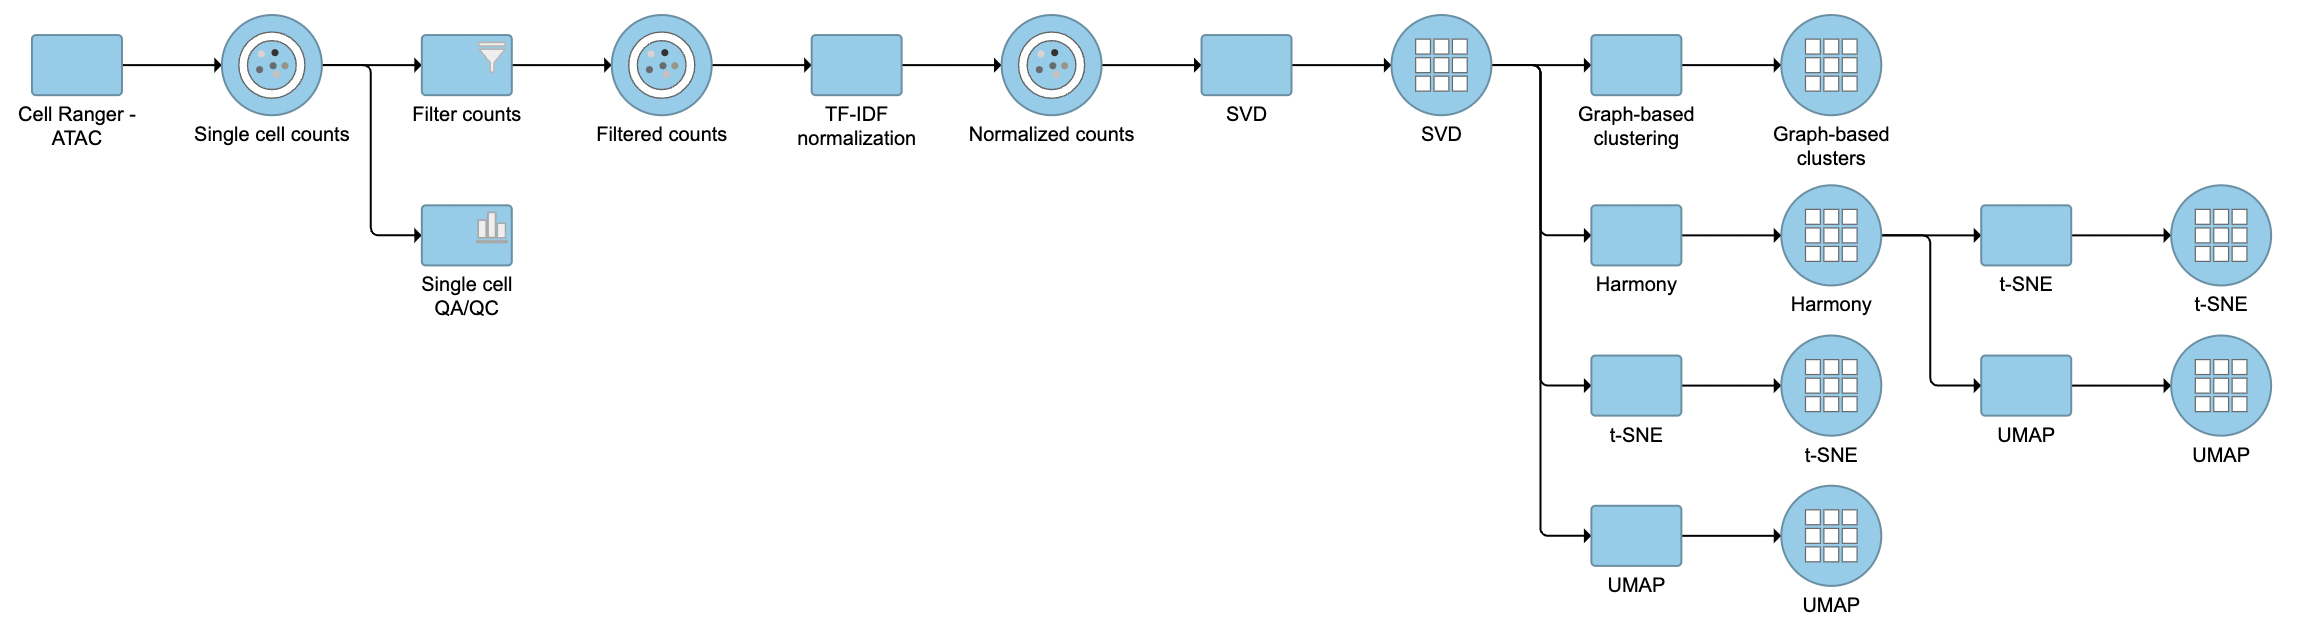
Figure 3. Example workflows to demonstrate downstream analysis and visualization of SVD output for scATAC-seq data.
References
- Cusanovich, D., Reddington, J., Garfield, D. et al. The cis-regulatory dynamics of embryonic development at single-cell resolution. Nature 555, 538–542 (2018). https://doi.org/10.1038/nature25981
Additional Assistance
If you need additional assistance, please visit our support page to submit a help ticket or find phone numbers for regional support.
Overview
Content Tools