The Chromosome view can be invoked from some data nodes on the Analysis tab, giving a global overview of the results; or from certain Task report or result pages, providing a focused view, i.e. pointing to a specific feature of interest.
Running a Chromosome View Task from a Data Node
On the Analysis tab, selecting a data node containing aligned reads, variants, or feature lists, shows Chromosome view in the Exploratory analysis section of the context-sensitive menu (Figure 1).
If Partek Flow has no information on the genome build, you will need to provide the species and genome build in a subsequent dialog (not shown). Otherwise, chromosome view will come up directly.
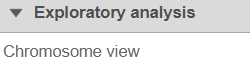
Figure 1. Accessing Chromosome view via the context-sensitive menu (the content of the Visualisation section depends on the selected data node)
A new Chromosome view task node will be added to the canvas (Figure 2) and in order to invoke the viewer <double-click> on the node (you can also select it and then go to Task report in the menu). When invoked in this way, the default visualization in the Chromosome view is the first 100,000 bases of the first chromosome.
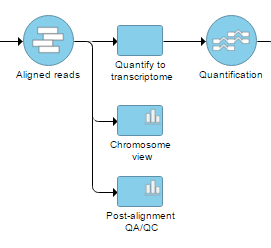 Figure 2. Selecting Chromosome view from the context-sensitive menu adds a Chromosome view task node to the canvas. To open the view, on it
Browsing directly to a location directly from a Task Report
Another way to get the Chromosome view is through a Task report. You can launch the viewer by selecting the chromosome icon ![]() in the View column (Figure 3) of GSA or View Variants reports. In that case, the Chromosome view will browse directly to the selected genomic location (i.e. a transcript or a variant, depending on the pipeline).
in the View column (Figure 3) of GSA or View Variants reports. In that case, the Chromosome view will browse directly to the selected genomic location (i.e. a transcript or a variant, depending on the pipeline).
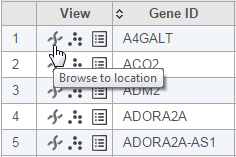 Figure 3. Accessing the Chromosome view from results table (mouse-over balloon is visible when hovering over the chromosome icon). The image is an example, based on gene expression pipeline
Depending on the task report used to invoke the Chromosome view was invoked, some tracks may be pre-selected and customized. For example, when invoked from a variant table, the reads histogram track will be colored by bases (rather than the default of coloring by sample).
Additional Assistance
If you need additional assistance, please visit our support page to submit a help ticket or find phone numbers for regional support.


| Your Rating: |
|
Results: |

|
35 | rates |
Overview
Content Tools
1 Comment
Melissa del Rosario
author: ilukic