Peak calling task is used to detect enriched genomic regions on reads generated from ChIP-seq, DNase-seq, MeDIP-seq etc. experiments. Partek® Flow® provides a widely used method MACS2-model-based analysis1 (http://liulab.dfci.harvard.edu/MACS/) to find peaks. It can be performed with or without control sample.
MACS2 dialog
Selecting MACS2 from the context sensitive menu will bring up the MACS2 task dialog. The interface will appear differently depending on the input aligned data node and whether there are sample attributes available in the Data tab.
If the selected aligned data node was imported, the reference assembly used during data alignment needs to be specified. Choose the Assembly from the drop-down list within the MACS2 dialogue (Figure 1). If the selected aligned data node was generated by Partek Flow, this option will not appear.
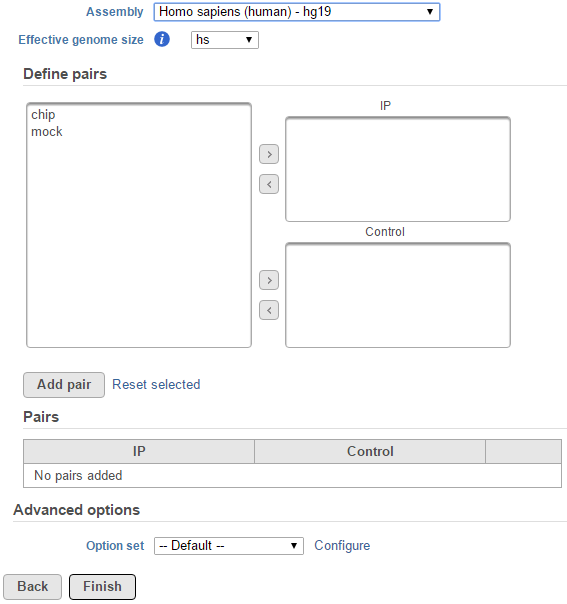 Figure 1. MACS2 dialog: manually add ChIP vs control pairs for peak detection
The effective genome size is the genome size of the regions that can be sequenced. Because of the repetitive features on the chromosomes, the actual mappable genome size will be smaller than the original size, typically about 70%-90% of the genome size. There are presets of 4 species based on MACS2 recommendation1 for this parameter:
hs – Homo sapiens, size is 2.7e9
mm – Mus musculus, size is 1.87e9
ce – Caenorhabditis elegans, size is 9e7
dm – Drosophila melongaster, size is 1.2e8
When Other... is selected, a specific value of the effective genome size needs to be specified with bps as unit (Figure 2).
![]() Figure 2. Specify other species effective genome size by manually type in the value
Figure 2. Specify other species effective genome size by manually type in the value
For data where no sample attributes were specified, for instance there are only two samples, the peak detection pairs needs to be manually defined. In the example in Figure 1, in the Define pairs section, the left panel lists all the sample names (chip and mock) . Add one pair at a time by selecting the chip sample to put in the IP panel on the top-right, and selecting the mock sample in the Control panel on the bottom-right. If there is no control sample in the experiment, the Control panel can be blank. If more than one ChIP or Control samples are added, the samples will be combined (or pooled) in the analysis.
For data where the sample attributes are defined (Figure 3), you will have an additional option to add pairs based on the attribute. Figure 3 shows an example data with 4 samples, 2 time points, and there is one IP sample and one Input sample in each time point.
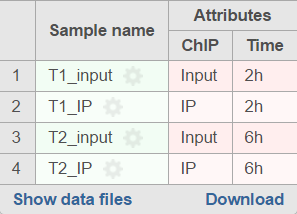 Figure 3. Experiment example data illustrate sample with two attributes: IP and Time
When running the MACS2 task, the default will be to use sample attribute to add multiple pairs with a single mouse click (Figure 4).
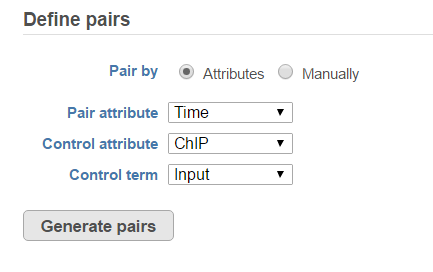 Figure 4. Specify IP vs control pairs based on sample attributes
There are IP-Input pair in each time point, so the pair attribute is Time. The Control attribute is the attribute that differentiates between the IP and the Input group, and in this example, it is the ChIP attribute. Finally, the control term is labeled as Input in the example. Click Generate pairs and the two pairs will be automatically added to the Pairs table (Figure 5).
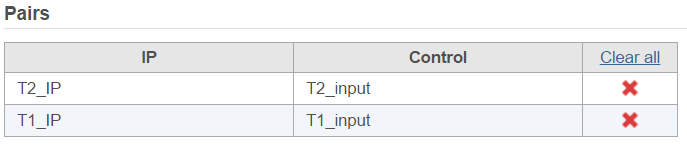 Figure 5. Two IP vs input sample pairs are added in the Pairs table
If multiple pairs are added in the Pairs table, the peak detection is performed on each pair independently.
Figure 5. Two IP vs input sample pairs are added in the Pairs table
If multiple pairs are added in the Pairs table, the peak detection is performed on each pair independently.
Peaks report
In the task report, each pair will generate a list of peaks displayed in a table (Figure 6).
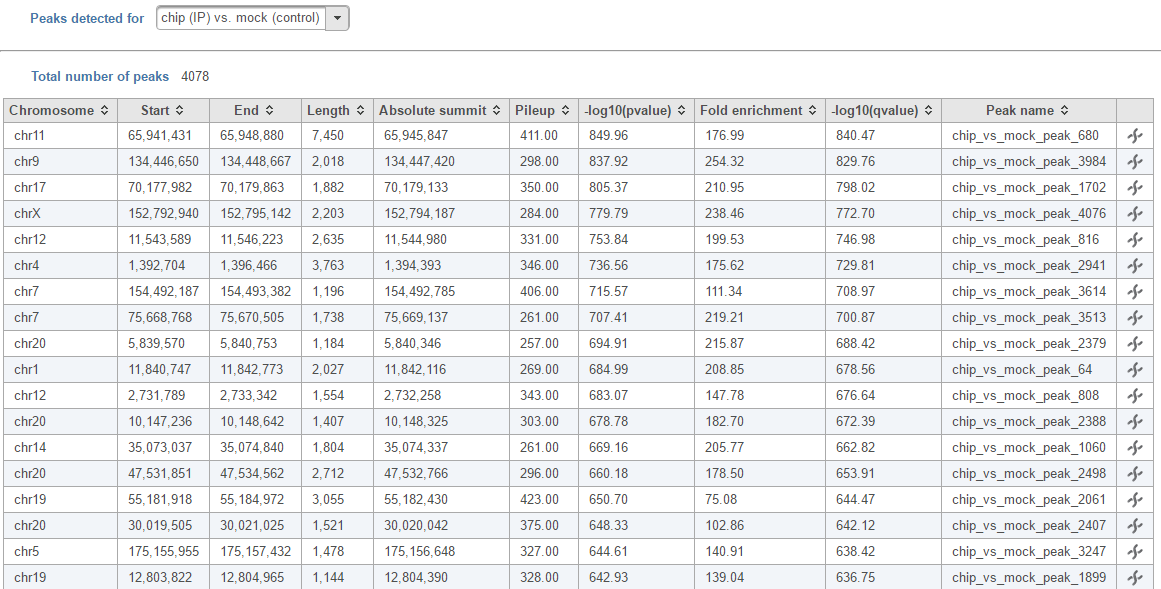 Figure 6. Peaks report on each IP vs control pair
In the report table, each row is a region of a peak. In addition, it also include the following information:
Figure 6. Peaks report on each IP vs control pair
In the report table, each row is a region of a peak. In addition, it also include the following information:
- Absolute summit: base pair location of peak summit
- Pileup: pileup height at peak summit
- -log10(pvalue): negative log10 pvalue for the peak summit
- Fold enricment: fold enrichhment for thhe peak summit against random Poisson distribution with local lambda
- -log10(qvalue): negative log10 qvalue at peak summit
- a peak name generated by the MACS2 algorithm
Click the browse to peak button (![]() ) to invoke chromosome view and zoom into that location.
) to invoke chromosome view and zoom into that location.
Click the Download button at the lower-right corner to download the peaks in a text file.
References
- Zhang Y, Liu T, et al. Model-based Analysis of ChIP-Seq (MACS). Genome Biol. 2008;9(9):R137.
Additional Assistance
If you need additional assistance, please visit our support page to submit a help ticket or find phone numbers for regional support.


| Your Rating: |
|
Results: |

|
1 | rates |
Overview
Content Tools