Multi-omics single cell analysis is based on simultaneous detection of different types of biological molecules on the same cells. Common multi-omics techniques include feature barcoding or CITE-seq (cellular indexing of transcriptomes and epitopes by sequencing) technologies, which enable parallel assessment of gene and protein expression. Specific bioinformatics tools have been developed to enable scientists to integrate results of multiple assays and learn relative importance of each type (or each biological molecule) in identification of cell types. Partek Flow supports weighted nearest neighbor (WNN) analysis (1), which can help combine output of two molecular assays.
Invoking Find Multimodal Neighbours
To start, select a PCA data node of one of the assays (e.g. gene expression) and go to Exploratory analysis > Find multimodal neighbors in the toolbox. On the task setup page, use the Select data node button to point to the PCA data node of the other assay (e.g. protein expression) (Figure 1).
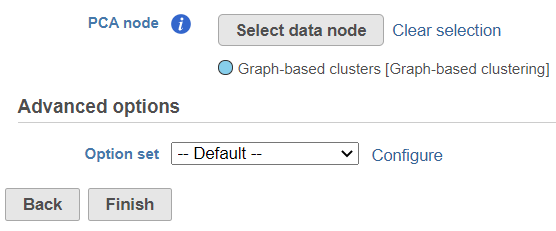 Figure 1. Setting up the Find multimodal neighbors task. Use the Select data node button to point to the second (of two) assay
When you click the Select data node button, Partek Flow will open another dialog, showing your current pipeline (Figure 2). Data nodes that can be used for WNN are in blue. To pick a node, left-click on it and then push the Select button.
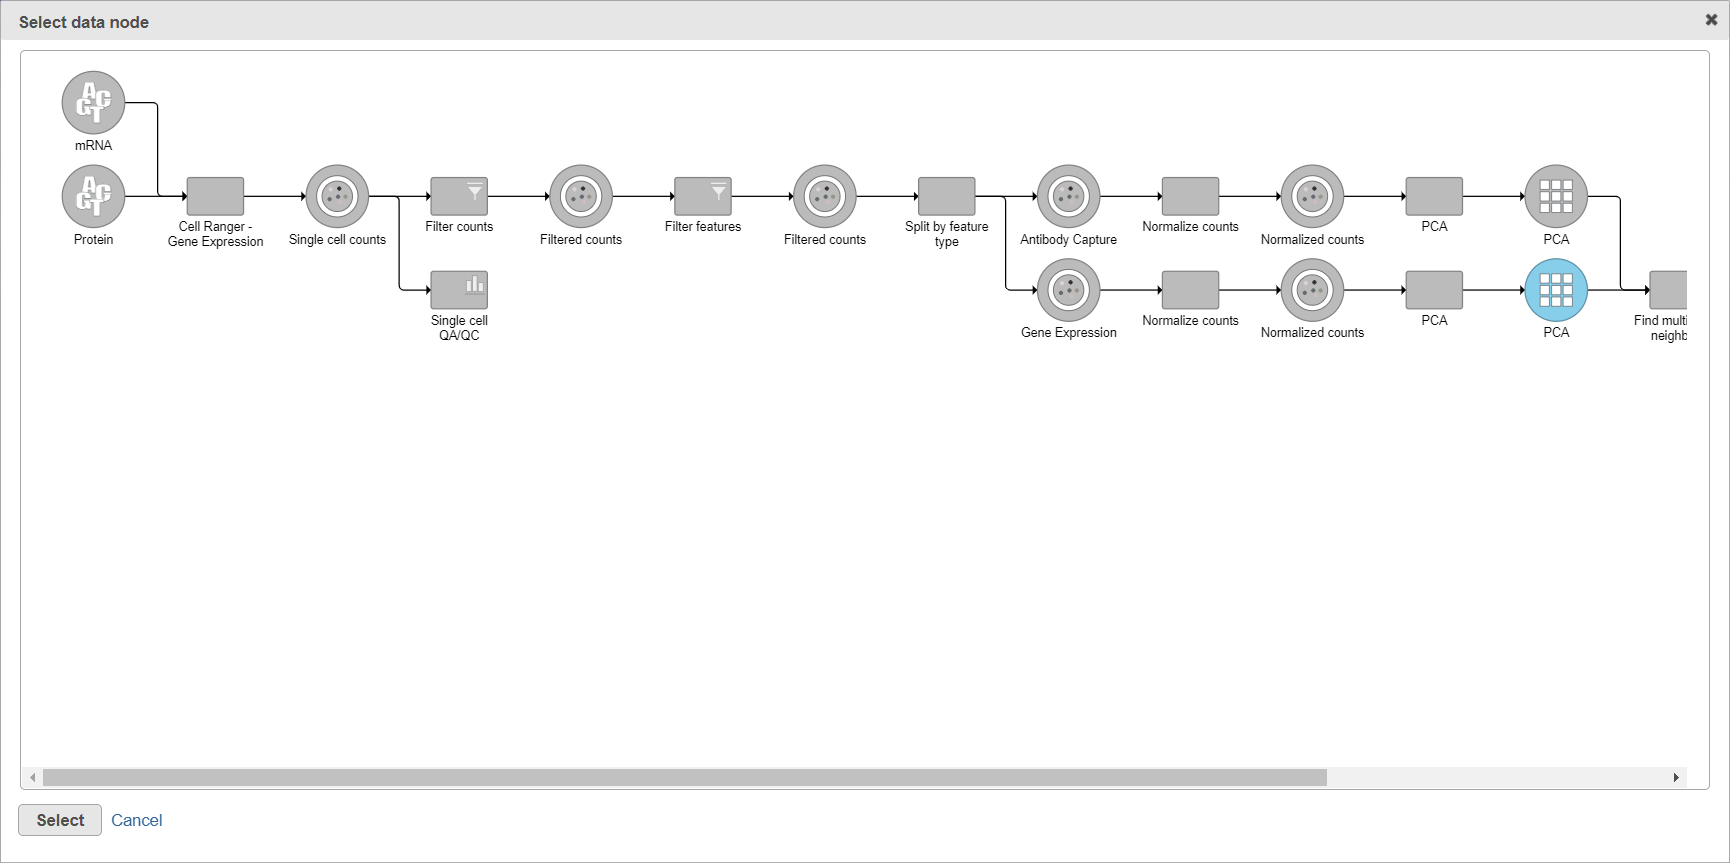 Figure 2. Select data node dialog. A node that can be used for WNN is highlighted in blue (in this example, the PCA node on the right)
The selected data node is shown under the Select data node button. If you made a mistake, use the Clear selection link (Figure 3).
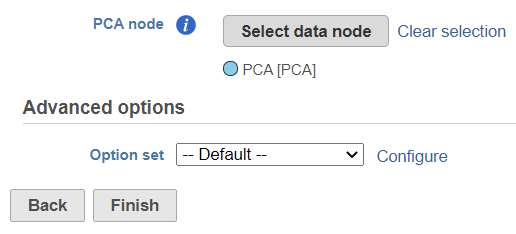 Figure 3. Currently selected data node shown under the Select data node button (in this example: PCA). To change the node, use the Clear selection link
To customize the Advanced options, select the Configure link (Figure 3). At present you can only change the number of nearest neighbors for each modality (-k.nn option of the Seurat package); the default value is 20 (Figure 4). An illustration on how to use that option to assess the robustness of WNN analysis can be found in Hao et al. (1).
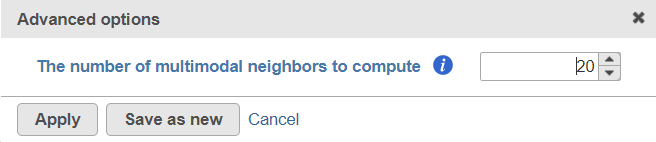 Figure 4. Advanced options of the Find multimodal neighbors
To launch the Find multimodal neighbors task, click the Finish button on the task setup page (Figure 3). For each cell, the WNN algorithm calculates its closest neighbors based on a weighted combination of RNA and protein similarities. The output of the Find multimodal neighbors task is a WNN data node.
For downstream analysis, you can launch a UMAP or graph-based clustering tasks on a WNN node. For example, Figure 5 shows a snippet of analysis of a feature barcoding data set; gene expression and protein expression data were processed separately, and then Find multimodal neighbors was invoked on two respective PCA data nodes.
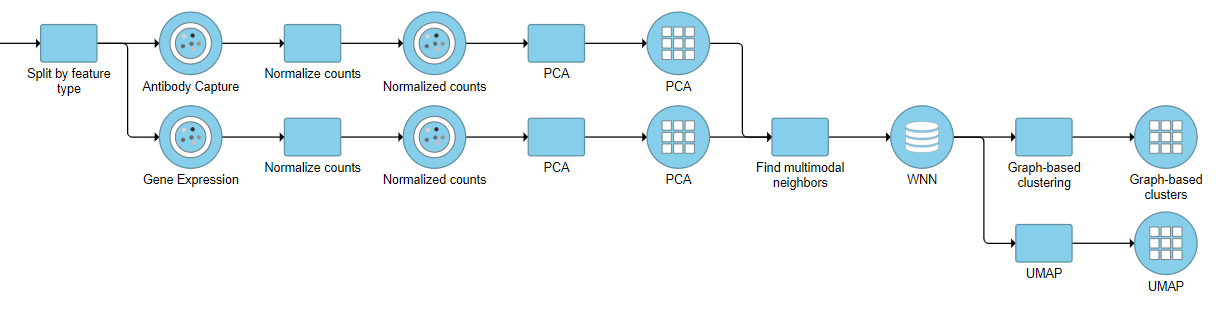 Figure 5. Example of a pipeline with a Find multimodal neighbors task and the resulting WNN data node
For an excellent illustration on advantages of WNN algorithm for identification of cell types, please see this blog post.
References
- Hao Y, Hao S, Andersen-Nissen E, et al. Integrated analysis of multimodal single-cell data. Cell. 2021;184(13):3573-3587.e29. doi:10.1016/j.cell.2021.04.048
Overview
Content Tools