Alpha & Beta Diversity
Alpha & beta diversity are measures of microbial population diversity.
Alpha diversity is a measure of the species diversity within a sample. Partek Flow can calculate two of the most commonly used alpha diversity metrics: Shannon index (1) & Simpson index (2). The Shannon index takes into account the number of different species (richness) and how evenly the counts are distributed among species (evenness). The more species you observe and more even their abundances are, the higher value of the Shannon index, in other words, the more diverse of the sample. The Simpson index gives more weight to more abundant species, and less weight to rare species. It scales from 0 to 1. The closer to 1, the higher the species diversity.
Beta diversity is a measure of between-sample diversity. Pairwise comparisons are made between each pair of samples and the distance matrix is fed through Principal Coordinates Analysis (PCoA) for visualization. This allows you to see how samples cluster together based on how similar/different their microbial communities are. Partek Flow calculates beta diversity using two dissimilarity distance metrics: Bray-Curtis coefficient (3,4) and Jaccard binary index (5,6). Bray-Curtis is a quantitative method, meaning it takes the abundance (i.e. the read counts) of each species into account when calculating dissimilarity. Jaccard binary index is a qualitative method, meaning it is based on the presence/absence of species and looks at the species overlap between two samples.
Quantitative approaches are generally more powerful in beta diversity assessment because the abundance data is more information-rich than presence/absence data. It can still be useful to compare quantitative and qualitative beta diversity results. For example, Kuczynski et al. (7) showed that qualitative methods can perform well on distinctly clustered samples but badly on subtly clustered samples, whereas quantitative methods can detect more subtle clusters. Thus, if a qualitative method (Jaccard) does not identify clusters and a quantitative method (Bray-Curtis) does, you can infer that the observed clusters are more subtle.
Running Alpha & Beta Diversity
The task can be performed on a Taxonomic data node, which is the output from a Kraken task. Alpha & beta diversity estimates are performed on species-level read counts.
- Click a Taxonomic data node
- Choose Alpha & beta diversity from the Metagenomic section of the toolbox
- (optional) If you wish to compare the alpha diversity values between groups of samples, choose the factors to set up the ANOVA. This can be helpful if you want to see if there is a significant difference in species diversity between predefined groups. This is optional, so you can skip this if you want.
- Click Finish
If there is only one sample present, beta diversity will not be calculated and there will be no option to calculate the alpha diversity ANOVA.
The task report is stored in a rectangular task node (Figure 1).
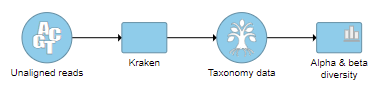 Figure 1. Alpha & beta diversity task node
Task report
The task report has two tabs: Alpha diversity report and Beta diversity report.
Alpha Diversity Report
The table at the top summarizes the Shannon and Simpson index for each sample. The table can be downloaded as a tab-delimited text file by clicking Download in the right corner of the table.
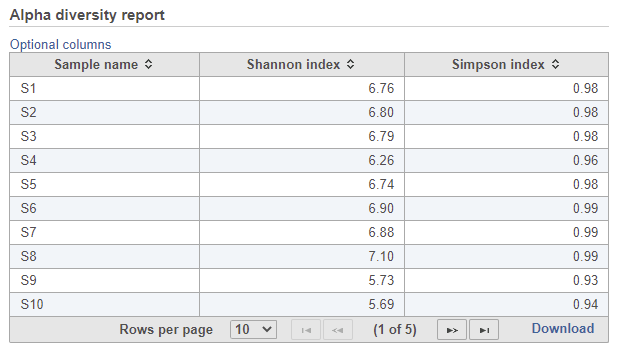 Figure 2. Example of the table showing the alpha diversity metrics for each sample
If the ANOVA was set up, there will be a table showing the results of the statistical analysis (Figure 2). A separate ANOVA test is performed for each alpha diversity metric to see if there is any significant difference between groups specified in the contrasts. If no ANOVA was set up, there will not be a table. See the GSA documentation for an explanation of each column.
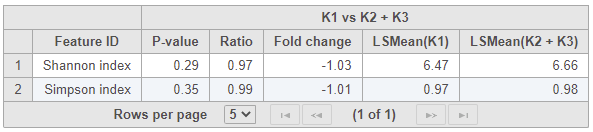 Figure 3. If the ANOVA was set up, the alpha diversity metrics will be compared across groups
At the bottom, there is a bar chart summarizing the Shannon and Simpson metrics for each sample (Figure 4).
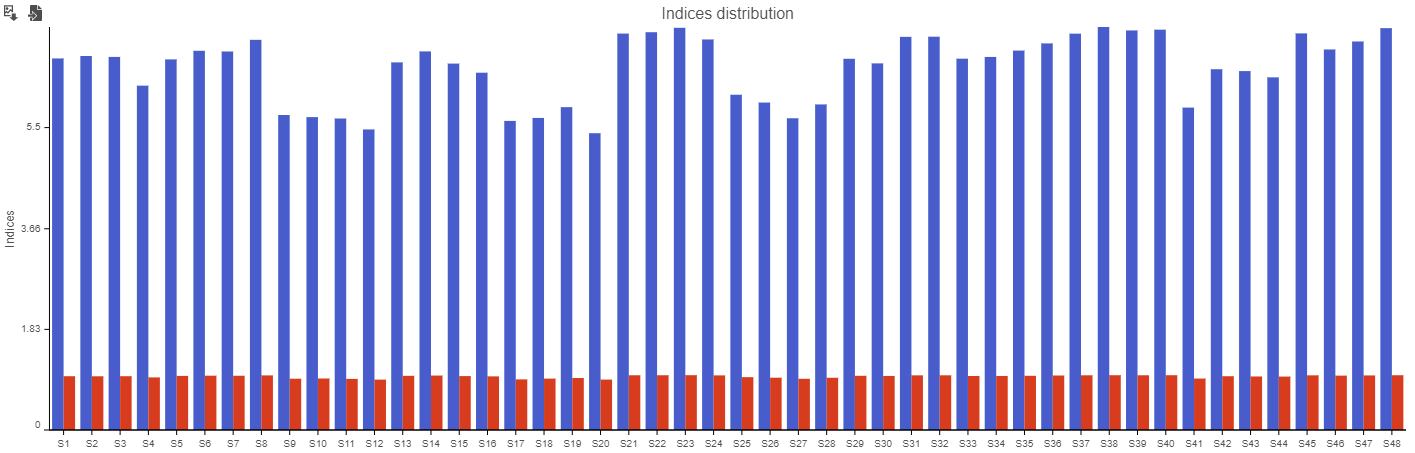 Figure 4. A bar chart showing the Shannon index (blue) and Simpson index (red) for each sample along the X-axis
Beta Diversity Report
To view the beta diversity results, click the Beta diversity report tab at the top.
The beta diversity results are presented in a Data viewer session, with two PCoA plots on the canvas. One plot shows the clustering based on the Bray-Curtis coefficient distance metric. The other shows the clustering on the Jaccard index distance metric. In both plots, each point is a different sample and they cluster together based on how similar their overall metagenomic profiles are. Points very close together are similar, points far apart are different. The Configuration panel on the left can be used to customize the plots.
To obtain the table of pairwise comparisons (dissimilarity matrix) for each distance metric, click the appropriate hyperlink below the Data viewer. The table will be downloaded as a tab-delimited text file. For both distance metrics, the values range from 0 to 1. The higher the value, the more different that pair of samples are. The lower the value, the more similar they are.
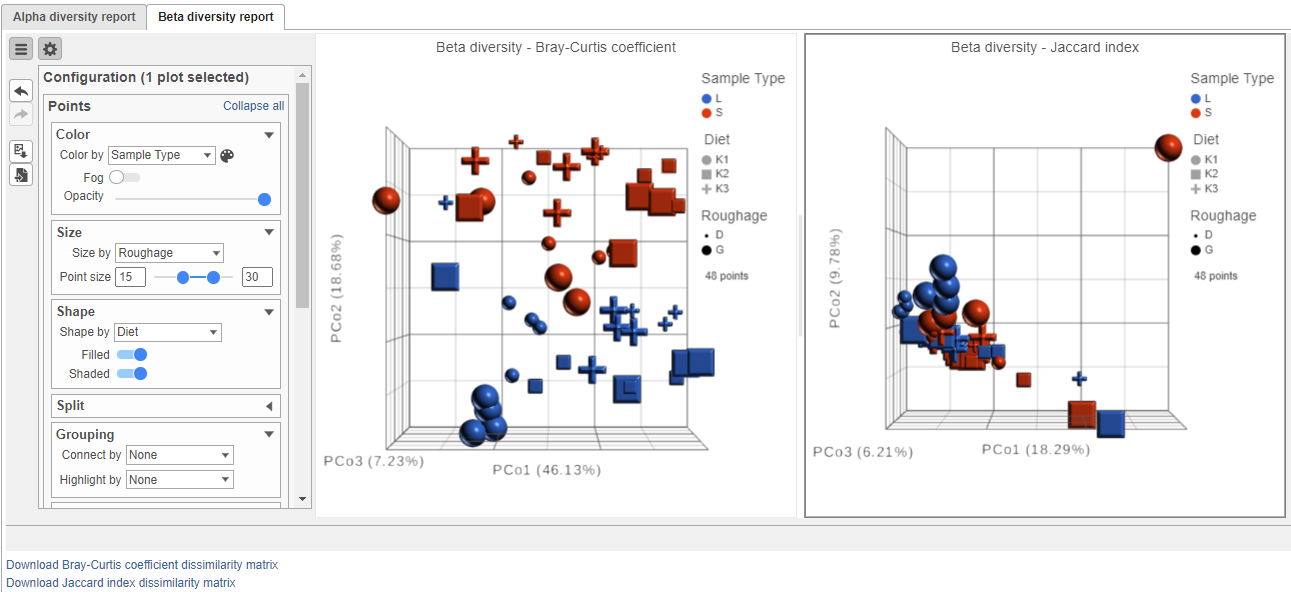 Figure 5. Example of a Beta diversity report
References
- Shannon CE: A mathematical theory of communication. Bell System Technical Journal 1948, 27.
- Simpson EH: Measurement of diversity. Nature 1949, 163: 688.
- Bray JR, Curtis JT: An ordination of upland forest communities of southern Wisconsin. Ecol Monogr 1957, 27.
- Beals E: Bray-Curtis ordination: an effective strategy for analysis of multivariate ecological data. Adv Ecol Res 1984, 14.
- Jaccard P: Lois de distribution florale. Bulletin de la Socíeté Vaudoise des Sciences Naturelles 1902, 38.
- Jaccard P: The distribution of the flora in the alpine zone. New Phytologist 1912, 11:2
- Kuczynski J, Liu Z, Lozupone C, McDonald D, Fierer N, Knight R: Microbial community resemblance methods differ in their ability to detect biologically relevant patterns. Nat Methods. 2010, 7:10
Additional Assistance
If you need additional assistance, please visit our support page to submit a help ticket or find phone numbers for regional support.


| Your Rating: |
|
Results: |

|
12 | rates |
Overview
Content Tools