What is Cell Ranger?
Cell Ranger is a set of analysis pipelines that process Chromium single-cell RNA-seq output to align reads, generate feature-barcode matrices and perform clustering and gene expression analysis for 10X Genomics Chromium Technology[1].
Cell ranger in Flow
Cell Ranger v6.0.0[2] has been wrapped In Partek® Flow® as Cell ranger task. It does not comprehensively cover all of the options and analysis cases Cell Ranger can handle for now, but converts FASTQ files from cellranger mkfastq and performs alignment, filtering, barcode counting, UMI counting. The output gene expression count matrix in .h5 format (both raw and filtered) then becomes the starting point for downstream analysis for scRNA-seq in Flow.
Running Cell ranger in Flow
To run the Cell ranger task in Flow, select Unaligned reads datanode, then select Cell ranger in the 10x Genomics section (Figure 1).
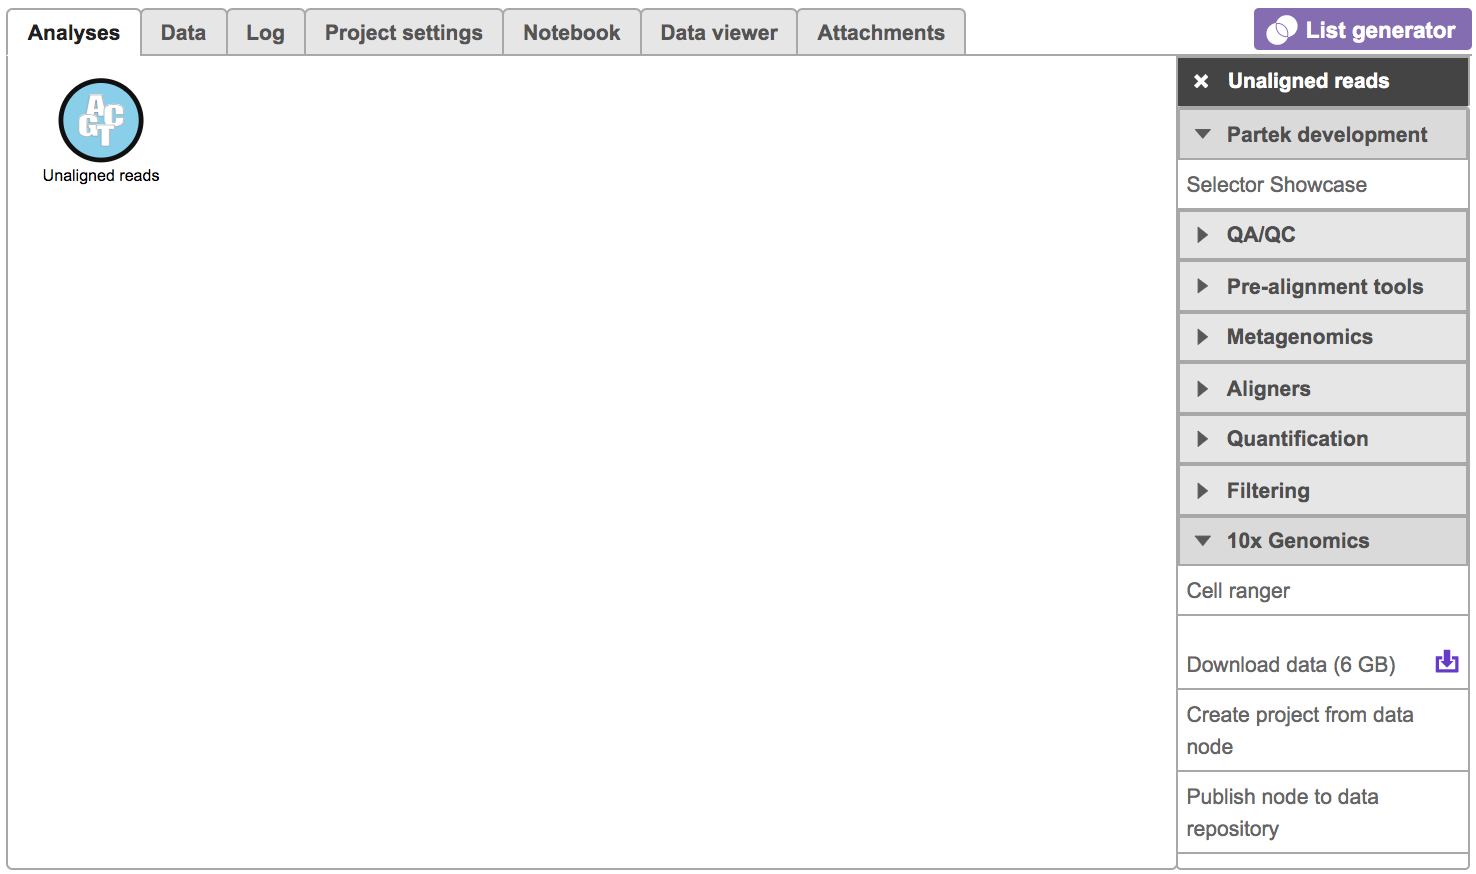
Figure 1. Selecting the Cell ranger task for converting fastqs to Single cell counts.
Users will be asked to create a Cell Ranger 6.0.0 reference genome if it is the first time to run the Cell ranger task in Flow (Figure 2).
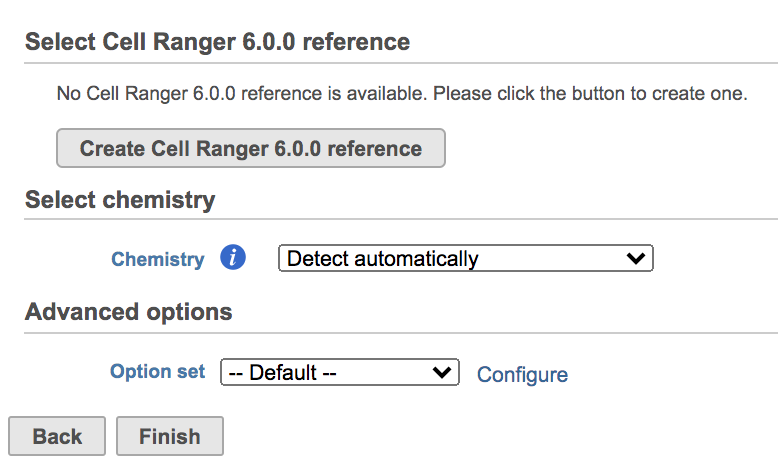
Figure 2. Create Cell Ranger 6.0.0 reference genome for the first time user.
Clicking the big grey button of Create Cell Ranger 6.0.0 reference would pop up a new window where lists the three pre-built reference genomes for human(hg38), mouse(mm10) and the both mixed genome (hg38-mm10), respectively (Figure 3). They are exactly the same reference genomes (2020-A) that are provided in Cell Ranger by default. In details, the transcriptome annotations are respectively GENCODE v32 for human and vM23 for mouse, which are equivalent to Ensembl 98[3]. References for other organisms currently are not available in Flow Cell ranger, and will be coming in the next version.
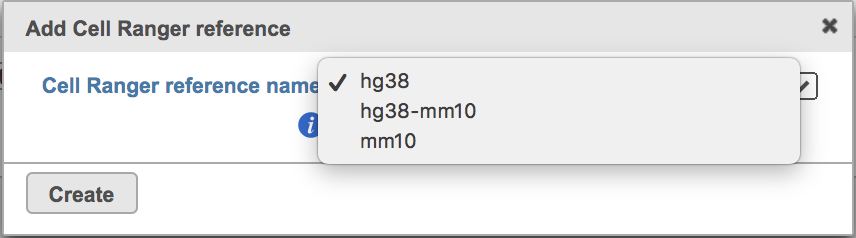
Figure 3. The available reference genomes in Flow Cell ranger.
Once the right reference has been chosen, simply press the Create button to finish. The reference of ‘hg38’ has been selected as an example here (Figure 4).
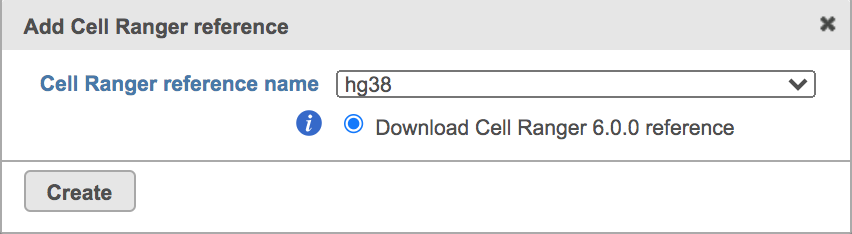
Figure 4. Create Human reference genome (hg38) for Cell ranger.
The main task menu will be refreshed as below (Figure 5) if references have been added. After the correct reference has been selected, users can go ahead click the Finish button to run the task as default.
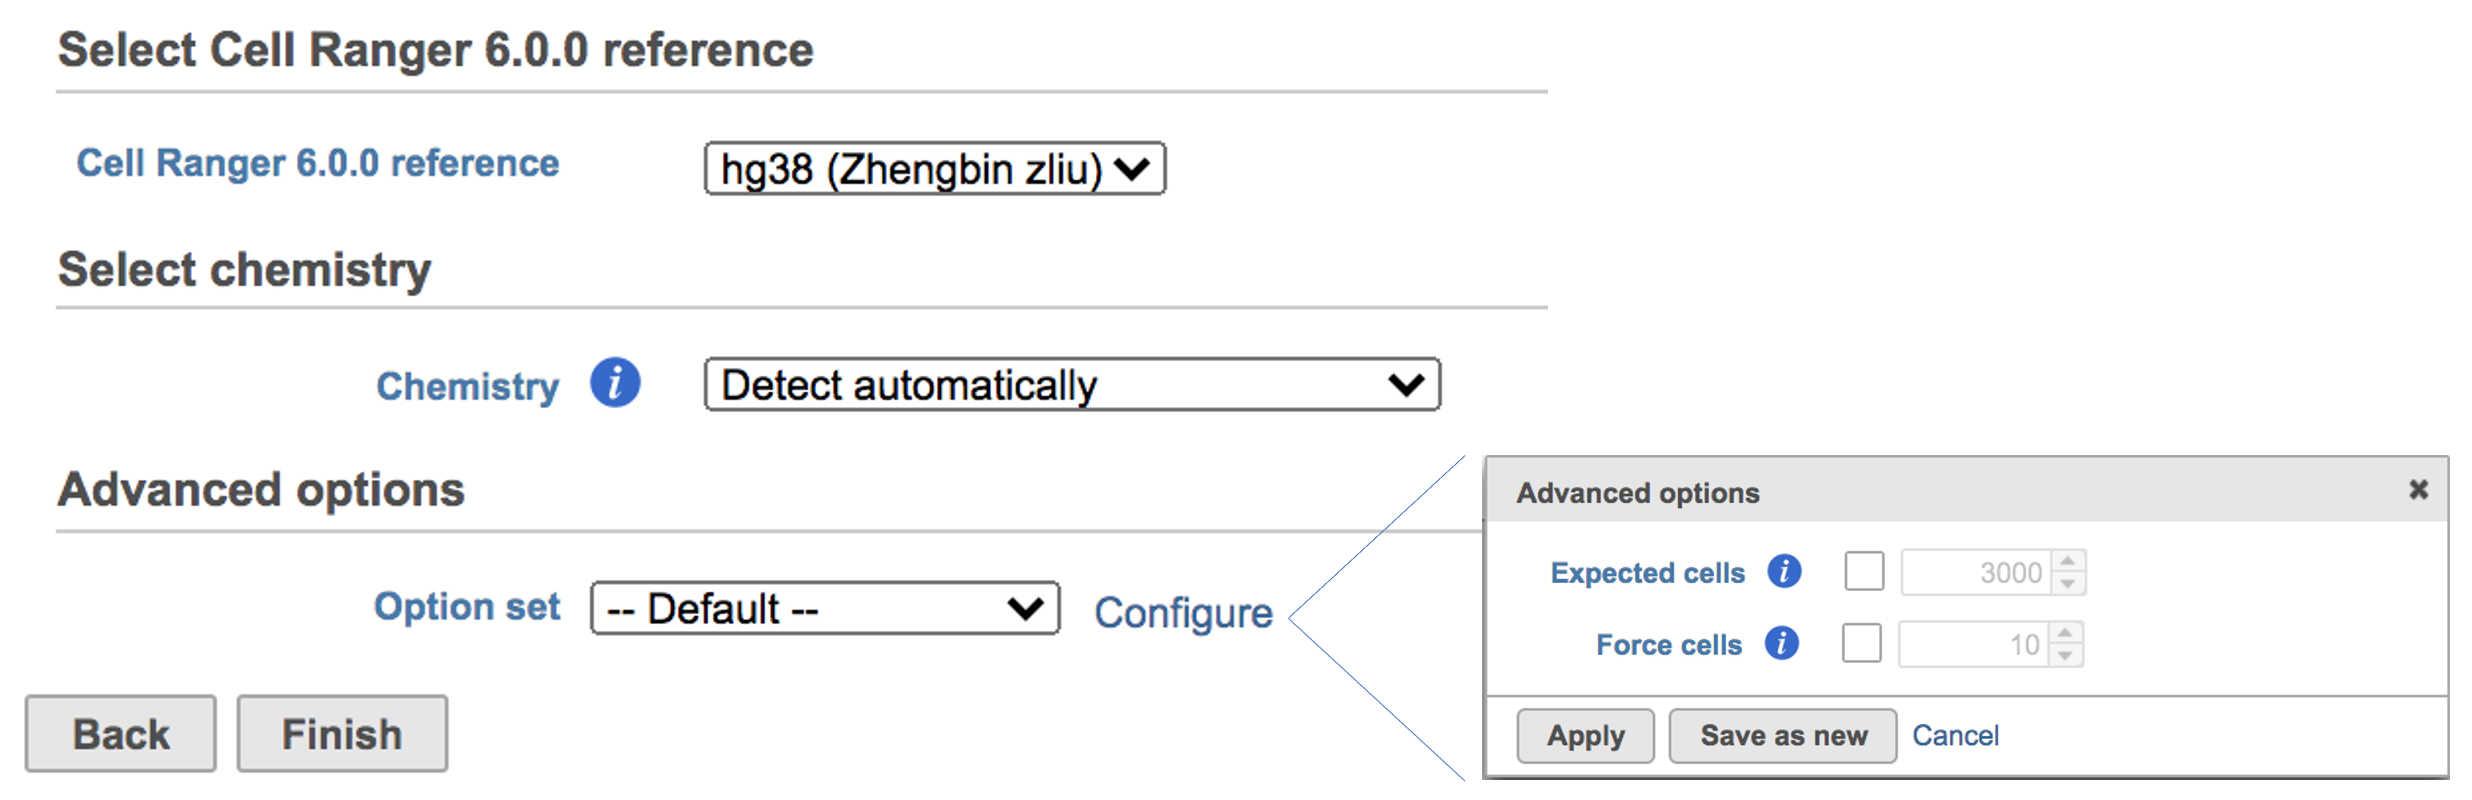
Figure 5. Run Cell ranger task with reference(hg38) in Flow.
A new data node named ‘Single cell counts’ will be displayed in Flow if the task is running (Figure 6). To open the task report, simply double click the output data node, or select the ‘Task report’ in the section after clicking the data node after the tasking running is finished. Users then will find the task report (Figure 7) is the same to the ‘Summary HTML’ from Cell Ranger output.
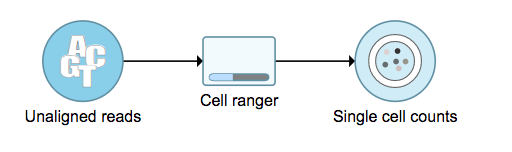
Figure 6. The running Cell ranger task in Flow.
Task report is sample based. Users can use the dropdown list on the top left to switch samples. Under the sample name, there are two tabs on each report - Summary report and Analysis report (Figure 7). Important information on Estimated Number of Cells, Mean Reads per Cell, Median Genes per Cell, as well as information on Sequencing, Mapping, and Sample are summarized in different panels. The Barcode Rank Plot has also been included as an important piece in the Cells panel in the Summary report (Figure 7).
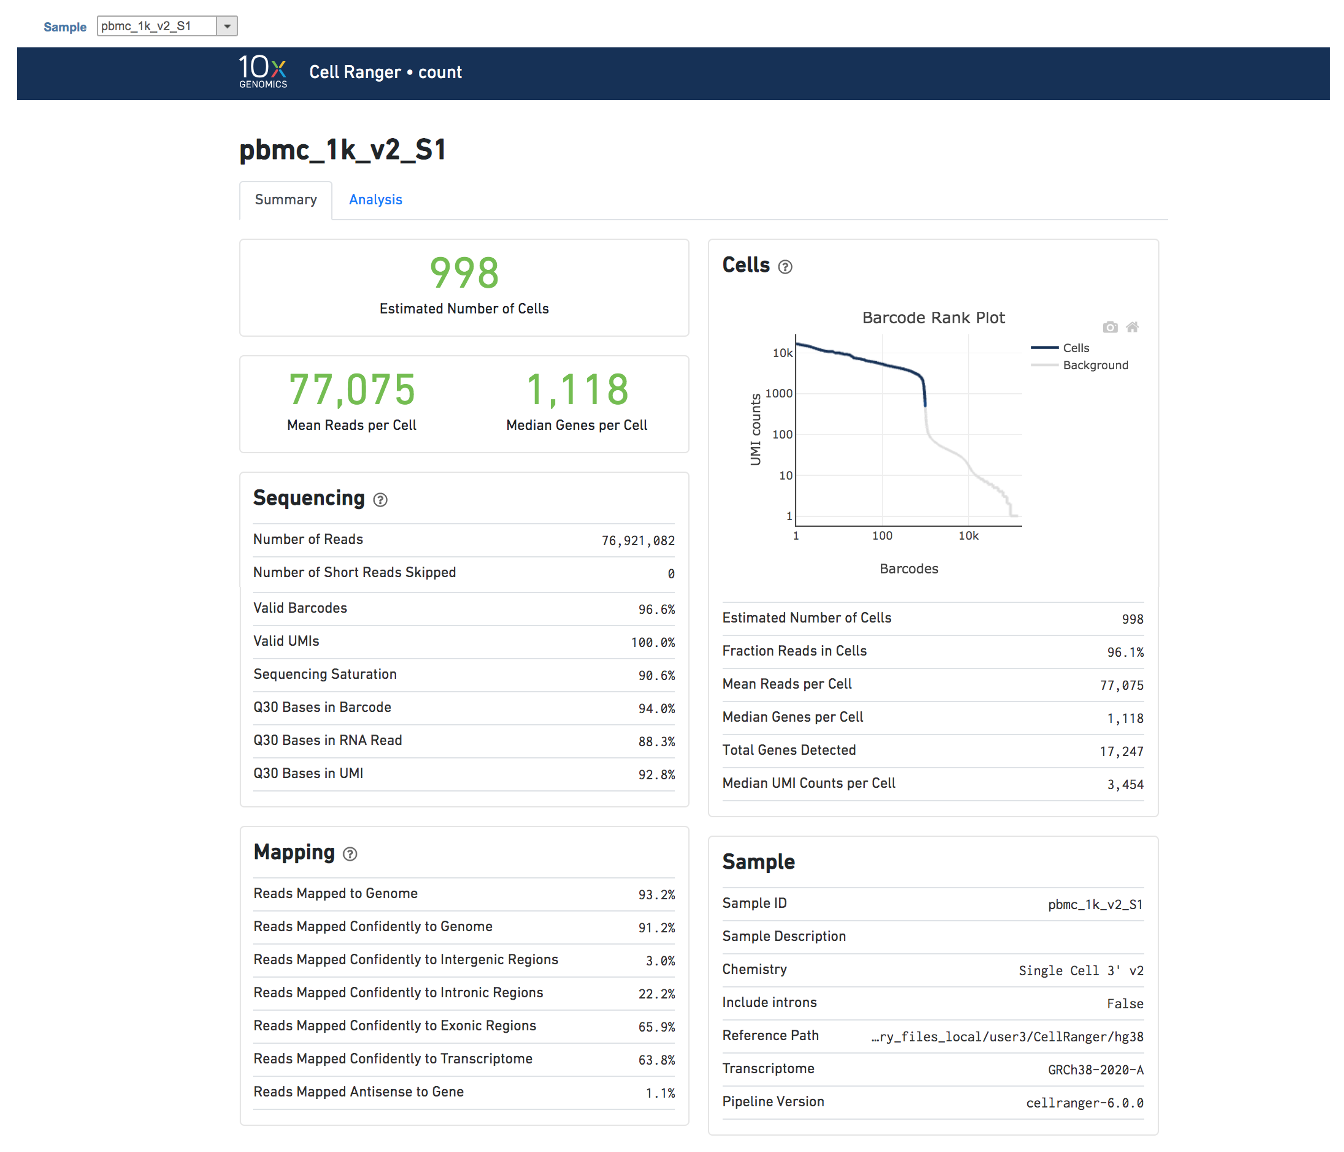
Figure 7. The example report of Cell ranger task in Flow.
Another two plots -biplots of Sequencing Saturation and Median Genes per Cell to Mean Reads per Cells have been included on the Analysis report as they are important metrics to the library complexity and sequencing depth (Figure 8).
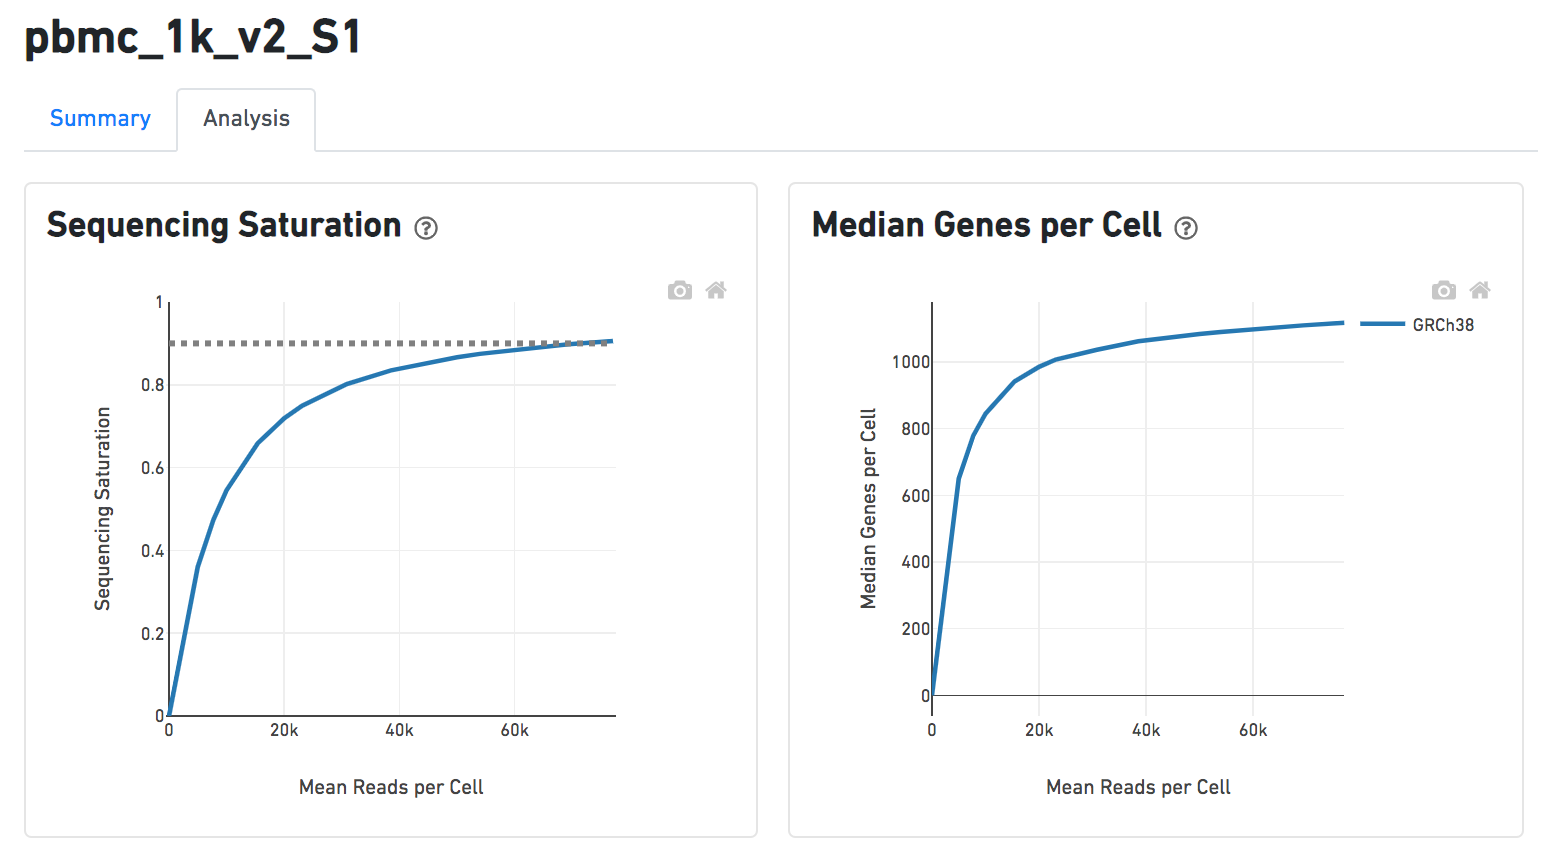
Figure 8. Analysis report of Cell ranger task in Flow.
A lot of details would be exhibited and the panel would be expanded correspondingly if the the symbol![]() in the panel on each report has been clicked. In the example below, the plot of Median Genes per Cell has been expanded while the Sequencing Saturation plot hasn't (Figure 9).
in the panel on each report has been clicked. In the example below, the plot of Median Genes per Cell has been expanded while the Sequencing Saturation plot hasn't (Figure 9).
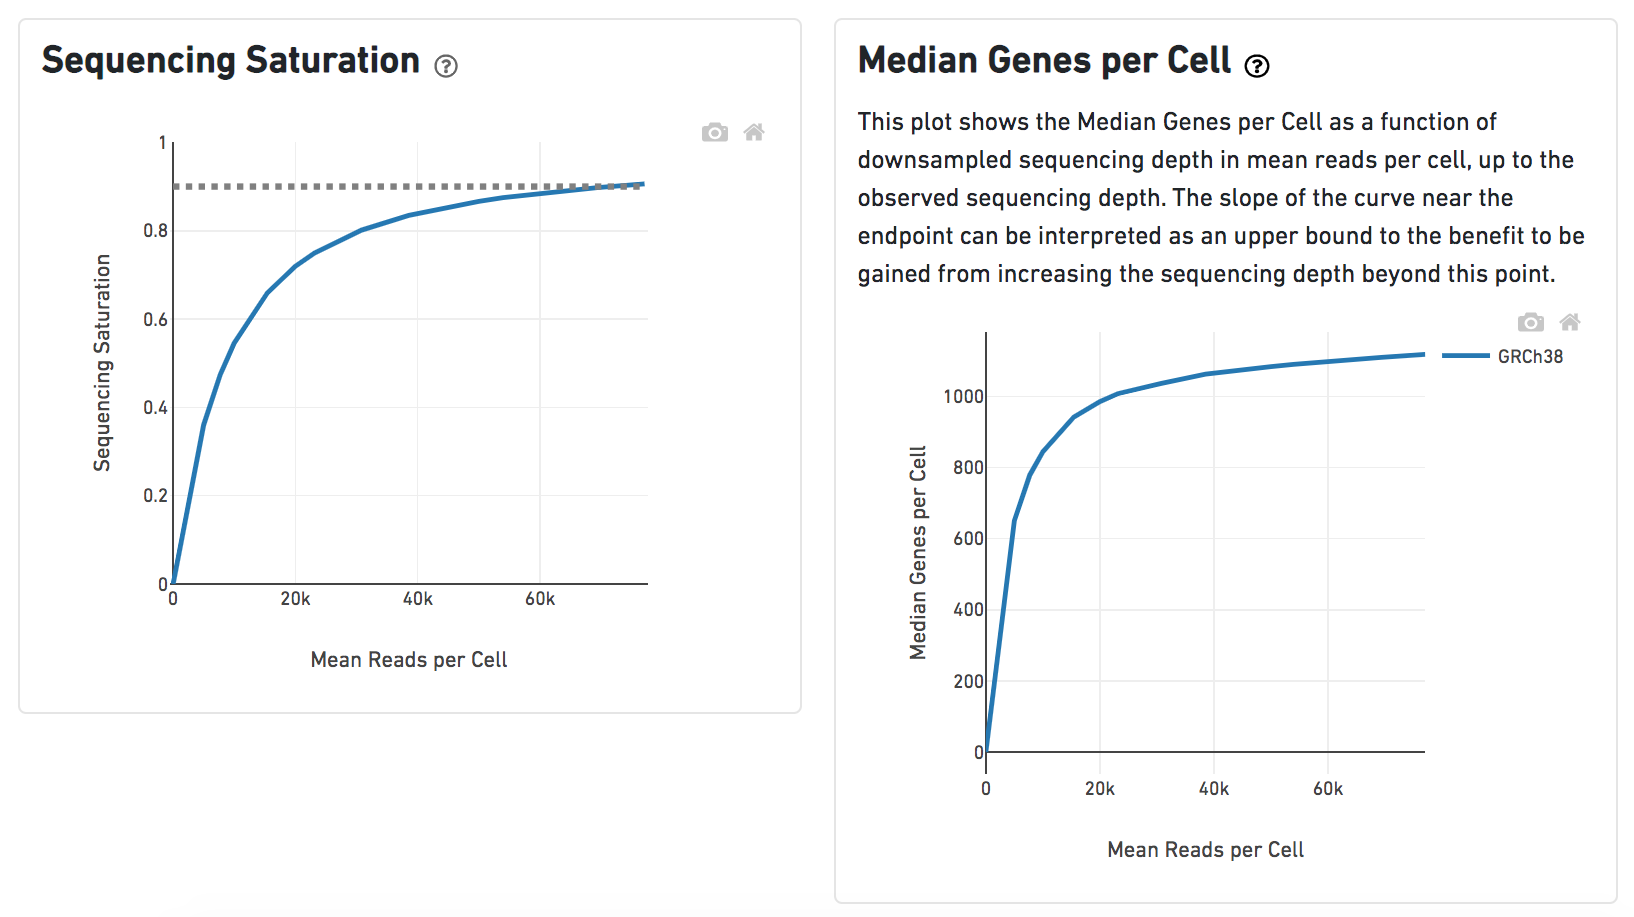
Figure 9. Analysis report of Cell ranger task in Flow.
Users can click Configure to change the default settings In Advanced options (Figure 5).
Expected cells: Expected number of recovered cells. Default: 3,000 cells.
Force cells: Force pipeline to use this number of cells, bypassing the cell detection algorithm. Use this if the number of cells estimated by Cell Ranger is not consistent with the barcode rank plot.
References
https://support.10xgenomics.com/single-cell-gene-expression/software/overview/welcome
https://support.10xgenomics.com/single-cell-gene-expression/software/pipelines/6.0/release-notes
- https://support.10xgenomics.com/single-cell-gene-expression/software/pipelines/4.0/release-notes
Additional Assistance
If you need additional assistance, please visit our support page to submit a help ticket or find phone numbers for regional support.


| Your Rating: |
|
Results: |

|
1 | rates |
Overview
Content Tools