What is Cell Ranger?
Cell Ranger is a set of analysis pipelines that process Chromium single-cell RNA-seq output to align reads, generate feature-barcode matrices and perform clustering and gene expression analysis for 10X Genomics Chromium Technology[1].
Cell ranger in Flow
Cell Ranger v6.0.0[2] has been wrapped In Partek® Flow® as Cell ranger task. It does not comprehensively cover all of the options and analysis cases Cell Ranger can handle for now, but converts FASTQ files from cellranger mkfastq and performs alignment, filtering, barcode counting, UMI counting. The output gene expression count matrix in .h5 format (both raw and filtered) then becomes the starting point for downstream analysis for scRNA-seq in Flow.
Running Cell ranger in Flow
To run the ‘Cell ranger’ task in Flow, select ‘Unaligned reads’ datanode, then select ‘Cell ranger’ in the ‘10x Genomics’ section (Figure 1).
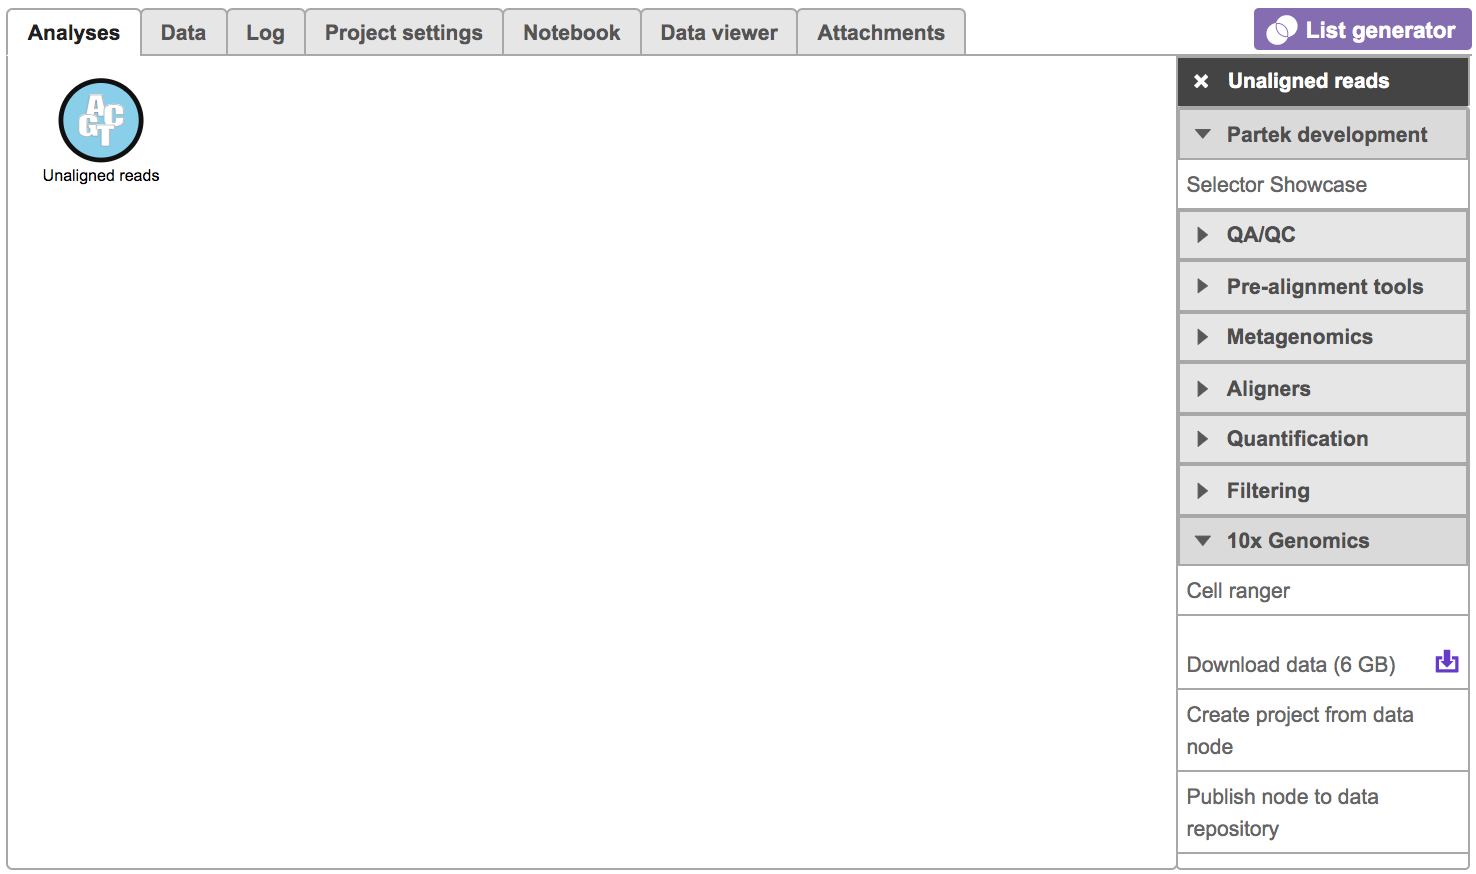
Figure 1. Selecting the Cell ranger task for converting fastqs to Single cell counts.
We recommend filtering to a set of genes you want to test for enrichment, but Gene set enrichment will run on any Feature list data node.
- Click a Feature list data node
- Click the Biological interpretation section of the toolbox
- Click Gene set enrichment
- Configure the background gene list (optional)
The background gene list is used as the list of possible genes. By default, this is the genes included in the selected gene set database. If your assay limits the genes that could be detected, you may want to specify a background list.
- Choose the Gene set
The gene sets available for the current Assembly are listed under the Gene set drop-down list. The assembly is automatically selected, if possible. If the assembly cannot be detected, you can specify it using a drop-down menu.
- Click Finish to run (Figure 1)

Figure 2. Selecting the gene set for Enrichment analysis. Sets available for the current Assembly are listed under Gene set
By default, the groups are defined by Gene Ontology (GO), a bioinformatics initiative to unify the representation of gene and gene product attributes across various species [1, 2].
Alternatively, selecting the Add gene ontology source from the Gene set drop down list option opens another dialog (Figure 3), where you can either Download gene set from Partek® (Recent GO database gene sets for human, mouse and rat are available) or Import gene set. The latter option takes you to the file browser, where you can point to the file that you want to use (not shown). Partek® Flow® accepts .gmt files as gene set inputs.

Figure 3. Adding gene set files via Create gene list dialog. Download gene set obtains a gene set file from Partek (human, mouse and rat are supported), Import gene set opens a file browser, which is used to specify the file that should be added to the Library file management functionality
The result is stored under an Enrichment task node. To open it, double click on the node or select the respective Task report from the context sensitive menu.
Cell ranger task report
Figure 4 shows an example Gene set enrichment task report. The table contains one gene set per row (Gene set column; the column entries are hyperlinks when using the distributed GO gene sets), with the category name in the Description column. The categories are ranked by the Enrichment score, which is the negative natural logarithm of the enrichment p-value (P-value column) derived from Fisher's exact test on the underlying contingency table. The higher the enrichment score, the more overrepresented the GO category is within the input list of significant genes. The columns can be searched by typing in the search term in the respective box (and hitting Enter), or sorted by selecting the double arrow icon ( ![]() ).
).
Figure 4. Go enrichment report (truncated). Gene set column contains Gene Ontology identifiers (hyperlinks). Category labels are in the Description column. Enrichment score: negative natural logarithm of the enrichment P-value derived from the Fisher's exact test. Genes in list: number of genes that are present both in the list of significant genes and the gene set (GO category). Genes not in list: number of genes that are present in the gene set, but are not present in the list of significant genes. The column on the right contains links to gene breakdown chart and extra details
The contingency table (Figure 5) can be displayed by selecting the View gene breakdown chart icon on the right (![]() ). The term "list" refers to the list of significant genes, while the term "set" refers to the respective GO category. The first row of the contingency table is also seen in the report, namely the Genes in list and Genes not in list columns.
). The term "list" refers to the list of significant genes, while the term "set" refers to the respective GO category. The first row of the contingency table is also seen in the report, namely the Genes in list and Genes not in list columns.

Figure 5. Contingency table used to calculate the enrichment p-value. List refers to the list of significant genes, set refers to the gene ontology category
The View extra details (![]() ) button provides additional information on the GO category (Figure 6). In addition to the details already given in the report, a full list of Genes in list and Genes not in list can be inspected and downloaded (Download data) to the local computer as a text file.
) button provides additional information on the GO category (Figure 6). In addition to the details already given in the report, a full list of Genes in list and Genes not in list can be inspected and downloaded (Download data) to the local computer as a text file.

Figure 6. Gene ontology enrichment extra details
As previously mentioned, if you are using the GO gene sets distributed by Partek, the GO identifiers in the first column are hyperlinks to the Gene Ontology web-site entries (an example shown in Figure 7).

Figure 7. Selecting a GO category in the table report opens up a browser and displays additional information on that category via GO web-page
References
https://support.10xgenomics.com/single-cell-gene-expression/software/overview/welcome
https://support.10xgenomics.com/single-cell-gene-expression/software/pipelines/6.0/release-notes
- https://support.10xgenomics.com/single-cell-gene-expression/software/pipelines/4.0/release-notes
Additional Assistance
If you need additional assistance, please visit our support page to submit a help ticket or find phone numbers for regional support.


| Your Rating: |
|
Results: |

|
1 | rates |
Overview
Content Tools