Descriptive statistics task can be invoked on matrix data node e.g. Gene Counts, Normalized Counts data node in bulk RNA seq analysis pipeline or Single Cell counts Data node etc. It calculates measures of central tendency and variability on observations or features of the matrix data.
Running Descriptive statistics
- Click on a counts data node
- Choose Descriptive Statistics in Pre-analysis tools section of the toolbox (Figure 1)
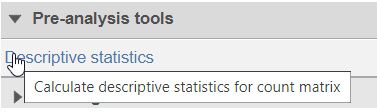
Figure 1. Descriptive statistics menu
This will invoke the dialog (Figure 2), select the calculation will be performed on samples (or cells on single cell count data node) or features

Figure 2. Select to calculate descriptive statistics on samples or cells
The available statistics are listed on the left panel, suppose "x1, x2, ..., xn"represent an array of numbers
- Coefficient of variation (CV):
 s represent the standard deviation
 - Geometric mean: g=

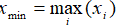
- Max:
- Mean:

- Median: when n is odd, median is
 , when n is even, median is
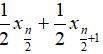
- Median absolute deviation:
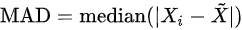 , where
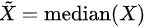
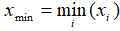
- Min:
- Non zero count: number of observations that is not zero
- Q1: 25th percentile
- Q3: 75th percentile
- Range: xmax - x min
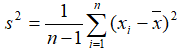
- Standard deviation:
 where
where 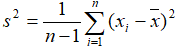
- Sum:

- Variance:
Left click to select measurement and drag to move to the right panel one at a time, or when you mouse over on a measurement, click on the green plus button to move to the right panel. When Sample (Cell) is select, the calculation will be performed on all the features in the input matrix for each sample (or cell). When Feature is selected, the calculation will be performed across all the samples (cells) in the input matrix for each feature.
In addition, when Feature is selected, there is an extra Group by option (Figure 3)
Figure 3. Choose a categorical attribute to calculate the statistics on each subgroup
From the drop-down list, choose a categorical attribute to calculate the descriptive statistics on all the subgroups for each feature
The output of the task is a matrix, it can be visualized in data viewer.
Additional Assistance
If you need additional assistance, please visit our support page to submit a help ticket or find phone numbers for regional support.


| Your Rating: |
|
Results: |

|
0 | rates |
Overview
Content Tools