Filter samples or cells in order to perform downstream analysis on a subset of data.
To filter groups, click a count matrix or single cell counts data node, click the Filtering section of the toolbox, and choose to Filter samples (bulk data) or Filter cells (single cell data).
The dialog lets you build a series of filters based on sample or cell attributes.
Click Finish to apply the filter. If no sample or cell will pass the filter criteria, a warning message will appear and the task will not run.
Configuring a filter
The first drop-down menu allows you to choose to include or exclude based on the specified criteria.
The second drop-down menu allows you to choose any categorical or numeric attribute to use for the filter criteria.
If the attribute is categorical, the third drop-down menu includes in and not in as options. A fourth drop-down menu allows you to search and choose from the levels of the selected attribute (Figure 1).
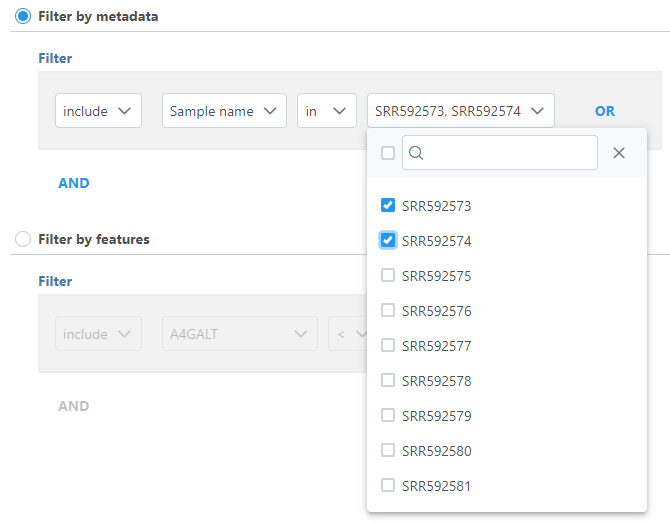
Figure 1. Filtering by a categorical attribute
If the attribute is numeric, the the third drop-down includes:
- <: less than
- <=: less than or equal to
- == equal to
- >: greater than
- >=: greater than or equal to
The threshold is set using the text box (Figure 2). The input must be a number; it can be an integer or decimal, positive or negative.
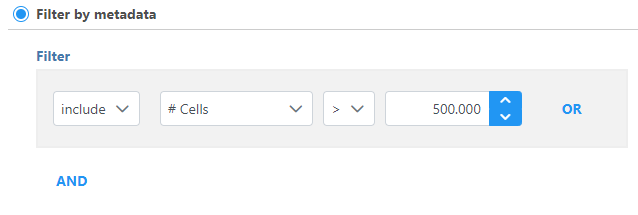
Figure 2. Filtering groups by a numeric attribute
Configuring multiple filters
Using the OR and AND options, you can combine multiple filters.
When combining multiple filters all set to Include:
With AND, if all statements must be true for the sample to meet the filter criteria.
With OR, if any statement is true, the sample will meet the filter criteria.
When combining multiple filters all set to Exclude:
With AND, if any statement is true, the sample will meet the filter criteria.
With OR, all statements must be true for the sample to meet the filter criteria.
Filter groups task report
The filter groups task report lists the filter criteria and reports feature distribution statistics for the remaining samples (Figure 3).
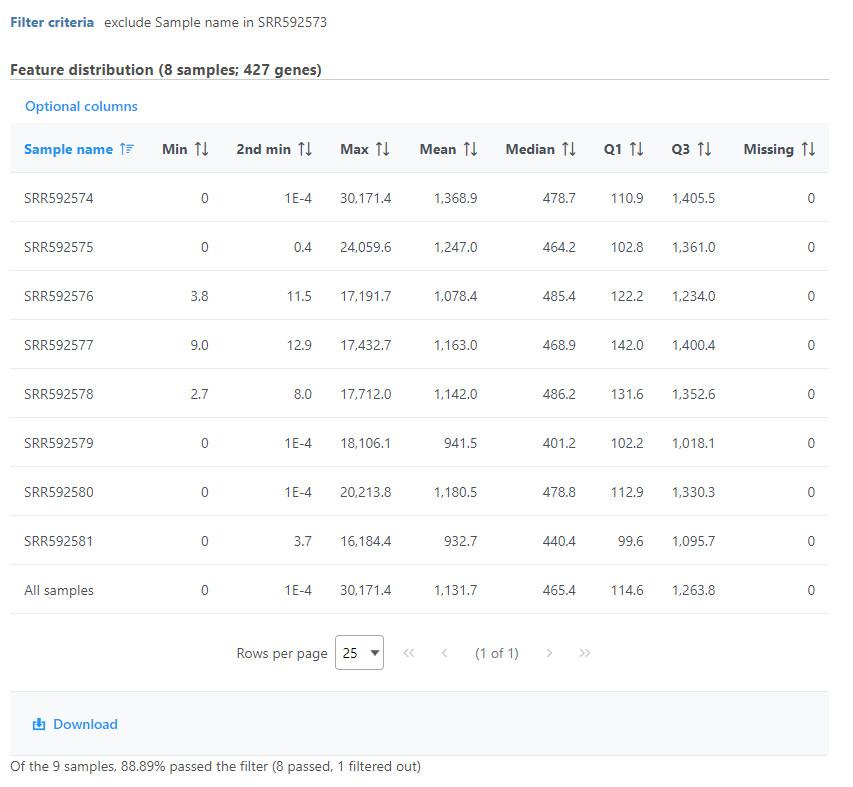
Figure 3. Filter samples task report - feature distribution table
If the input was a count matrix data node, the percentage of samples remaining after the filter is listed and charts are provided to show the breakdown of samples by categorical attributes before and after filtering (Figure 4).
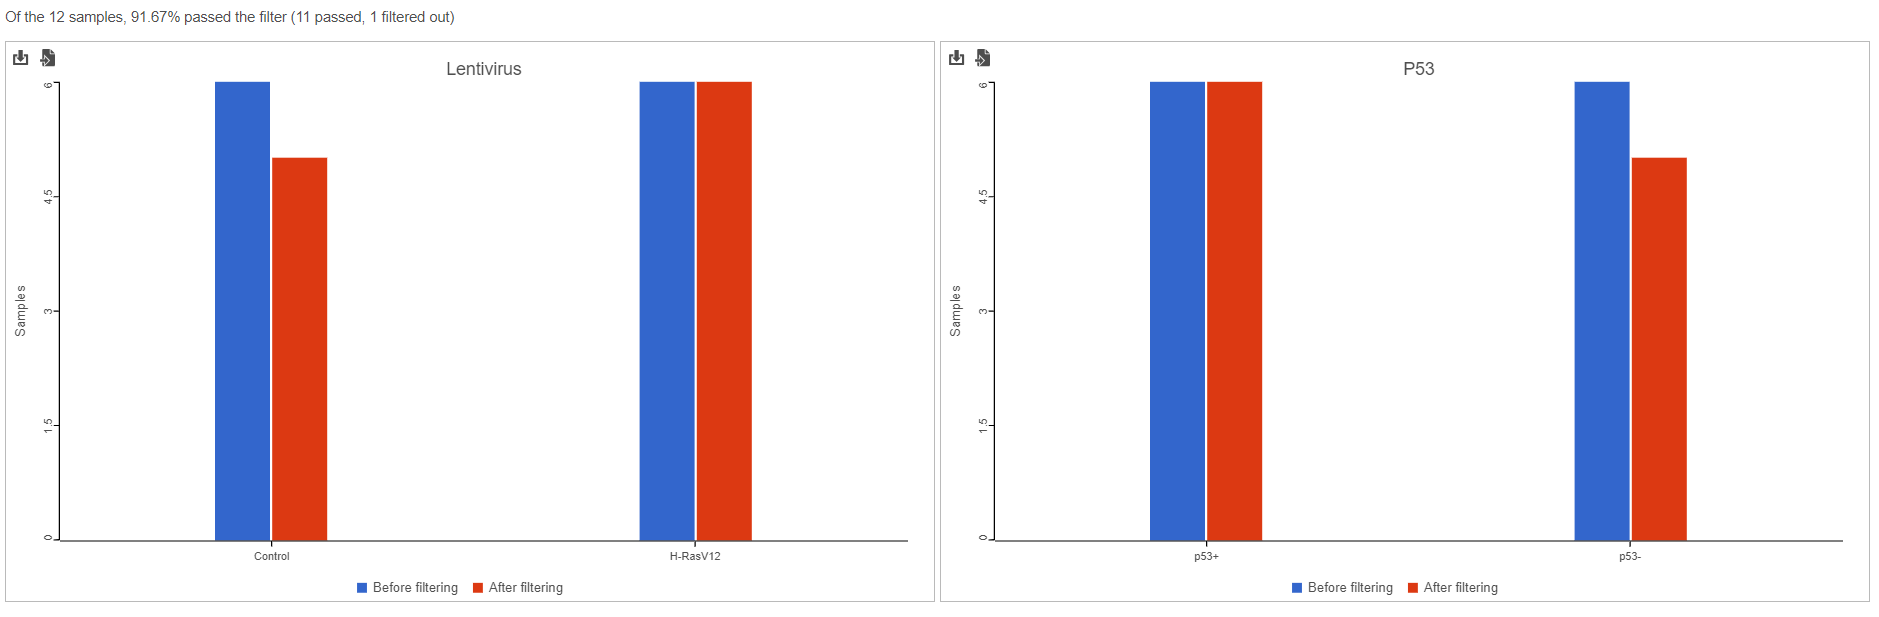
Figure 4. Filter samples report - feature distribution table
If the input was a single cell counts data node, a second table displays the details from each sample based on the filtered criteria (Figure 5).
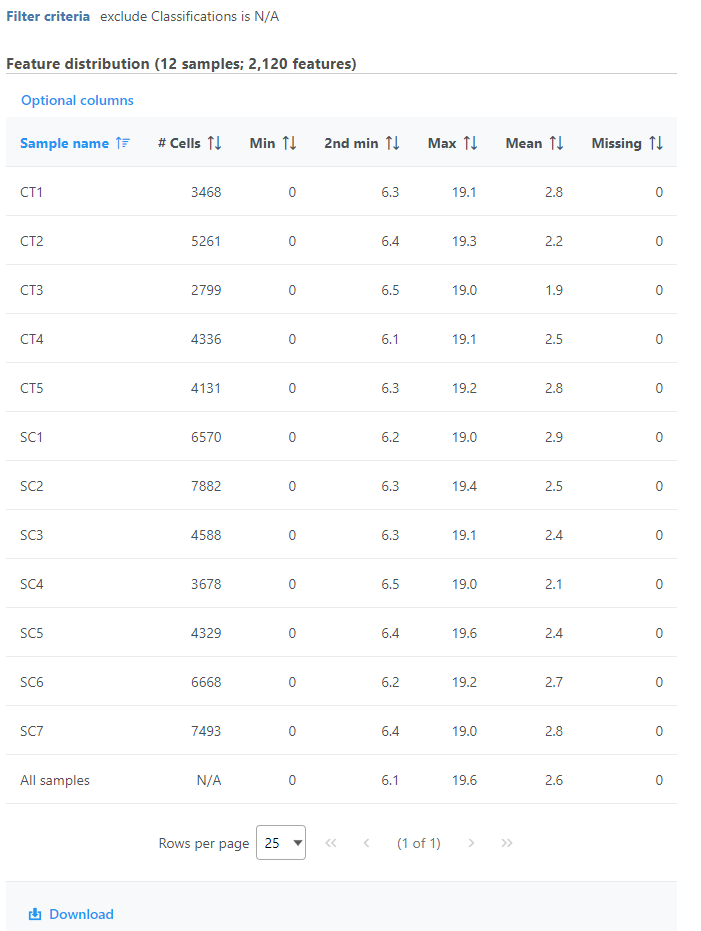
Figure 5. Filter cells - cell classification table
If the input was a classified groups single cell counts data node, the cell count table includes a breakdown by classification and a bar chart is provided to show the number of cells from each classification remaining after filtering (Figure 6).
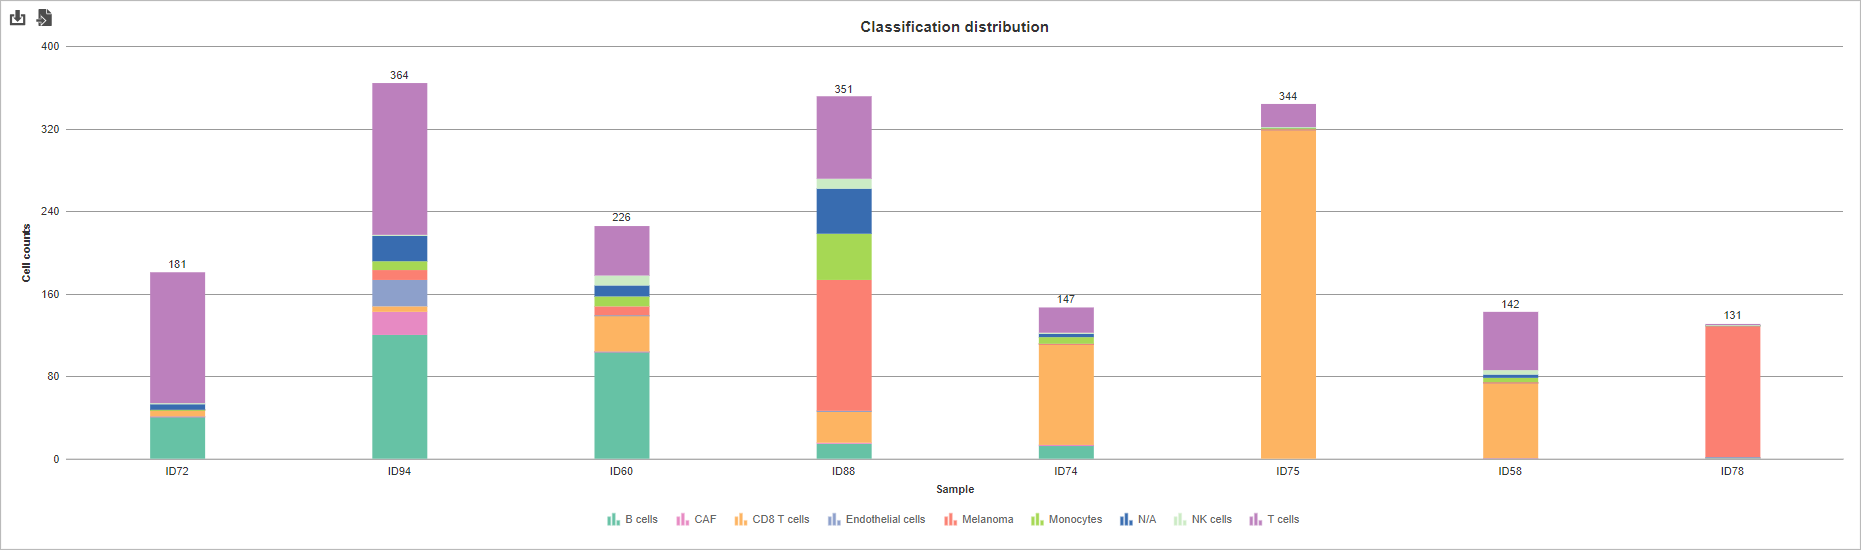
Figure 6. Filter cells - classification bar chart
Additional Assistance
If you need additional assistance, please visit our support page to submit a help ticket or find phone numbers for regional support.


| Your Rating: |
|
Results: |

|
29 | rates |
Overview
Content Tools