With a list of enriched regions, you can now identify recurring patterns or motifs in these regions. A transcription factor can bind to many sites throughout the genome. These sites usually share a certain pattern in their sequences termed a consensus sequence. By searching for these binding site motifs, you can determine the binding site pattern and the locations of binding throughout the genome.
Partek Genomics Suite detects de novo motifs using the Gibbs motif sampler (Neuwald et al., Protein Science, 1995) and can search for known transcription factor binding sites using a database such as JASPAR.
de novo Motif Discovery
- Select Motif discovery from the Peak Analysis section of the ChIP-Seq workflow
- Select Discover de novo motifs
- Select OK
The Detect Motifs dialog will open to allow you to configure the search (Figure 1).
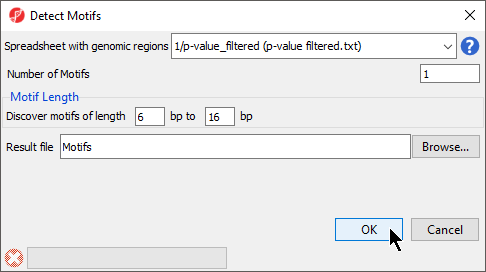
Figure 1. Configuring search parameters for de novo motfis
- Select 1/p-value_filtered from the Spreadsheet with genomic regions drop-down menu
- Set Number of Motifs to 1
- Set Discover motifs of lengthto 6 bp to 16 bp
- Set Result file to Motifs; the default save location is the folder you imported the .bam files from
- Select OK
If you have not previously downloaded the reference genome on your computer, you may be asked if you would like to download the .2bit reference genome. If prompted, select Automatically download a .2bit file then select OK. If Partek Genomics Suite cannot connect to the internet, this option may not be available. If not, you will need to download the .2bit file from the UCSC Genome Browser and import it by selecting Manually specify a .2bit file and choosing the downloaded .2bit file. The reference genome map is required to determine which genes overlap the enriched peak regions and to display the aligned sequences in the Genome Viewer.
A motif visualization tab will open and two spreadsheets will be generated. One spreadsheet, motifs (Motifs), contains information about the motif. The other, instances (Motifs_instances.txt), lists the genomic locations of the motif.
Description of Motif Detection Output
Sequence Logo Window
The Sequence Logo tab (Figure 2) graphically displays the best motif found in the regions listed in the source spreadsheet, p_value_filtered.

Figure 2. Viewing the binding site for NRSF. Use the blue arrows to cycle through views of all motif found (if there are more than one). Select Reverse to view the reverse complement sequence.
In this case, the motif finder discovered a motif in the NRSF-enriched regions that is 16 base pairs in length. The height of each position is the relative entropy (in bits) and indicates the importance of a base at a particular location in the binding site.
The title CT.TCC..GGT.CTG. is the consensus sequence for the sequence logo. Dots represent position that contain more than one base across all reads in the motif. The dots can be replaced with characters representing the possible bases at each location by selecting Show nucleotide codes. A description of the IUPAC nucleotide codes is available at the UCSC Genome Browser.
To view the reverse complement of the motif, select Reverse.
Motifs spreadsheet
The motif information spreadsheet (Figure 3), Motifs, lists the information about all motifs discovered during de novo Motif Detection. This includes five columns describing each motif.

Figure 3. Viewing the Motifs spreadsheet
1. Counts gives the summed counts for each base call across all occurrences of the motif in the region list as {A, C, G, T}
2. Consensus Sequence gives the consensus sequence of the motif in IUPAC nucleotide codes
3. Motif ID gives a unique ID to each discovered motif using its row in the Motifs spreadsheet
4. Log Likelihood Ratio scores the relative likelihood that the pattern did not occur by chance, with larger numbers indicating that it is less likely to have occurred by chance
5. Background frequency (A,C,G,T) gives the frequency of each of the bases in all the sequences of that motif
You can bring up the Sequence Logo visualization of a listed motif by right-clicking on the row header and selecting Logo View from the pop-up menu.
Motif_instances spreadsheet
The instances (Motif_instances) spreadsheet (Figure 4) is a child spreadsheet of the Motifs spreadsheet. It details all the locations of the motif(s) detected in the enriched regions. Each row lists a putative binding site for a motif. The columns give detailed information about the putative binding sites.

Figure 4. Viewing the instances spreadsheet
1 -4. chromosome, start, stop, strand give the position
5. Motif ID gives the identity of the motif
6. instance gives the sequence of this instance of the motif
7. score gives the log ratio of the probability that this sequence was generated by the motif versus the background distribution. A higher number indicates a better chance that the sequence is an instance of the motif.
Additional Assistance
If you need additional assistance, please visit our support page to submit a help ticket or find phone numbers for regional support.


| Your Rating: |
|
Results: |

|
0 | rates |
Overview
Content Tools