GO ANOVA output is very similar to standard ANOVA output except each row in the resulting sheet contains statistical results from a single GO functional group rather than a single gene. Columns can be broken down into four sections:
- Annotations contain detail about the category being considered
- ANOVA results contain the significance of the effect of the factors in the model
- Contrast results contain significance and fold change of the difference between groups compared via contrast
- F-ratios display the significance of the factors in the ANOVA model
Annotations
Annotations will take up the first four columns of the results sheet (Figure 1). The first column (# of genes) is the number of genes in the GO category. Specifically, this is not necessarily the number of unique genes in the category; depending on the technology, it can be the number of probes or probe sets on the microarray whose targets fall into the GO category. Genes targeted more than once will be counted more than once. The second column (GO ID) is the unique numeric identifier of the GO category; it is sometimes useful for searching with when the GO category has a very long name. The third column is the type of the GO category, while the fourth column (GO Description) is the name of the GO category.
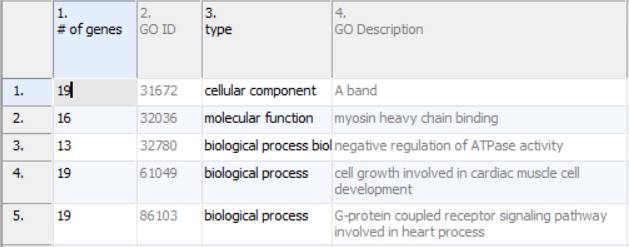 Figure 1. GO ANOVA annotation columns
Additional Assistance
If you need additional assistance, please visit our support page to submit a help ticket or find phone numbers for regional support.


| Your Rating: |
|
Results: |

|
0 | rates |
Overview
Content Tools