Partek Genomics Suite enables you to visualize each probe and compare the methylation between the groups at a single CpG site level.
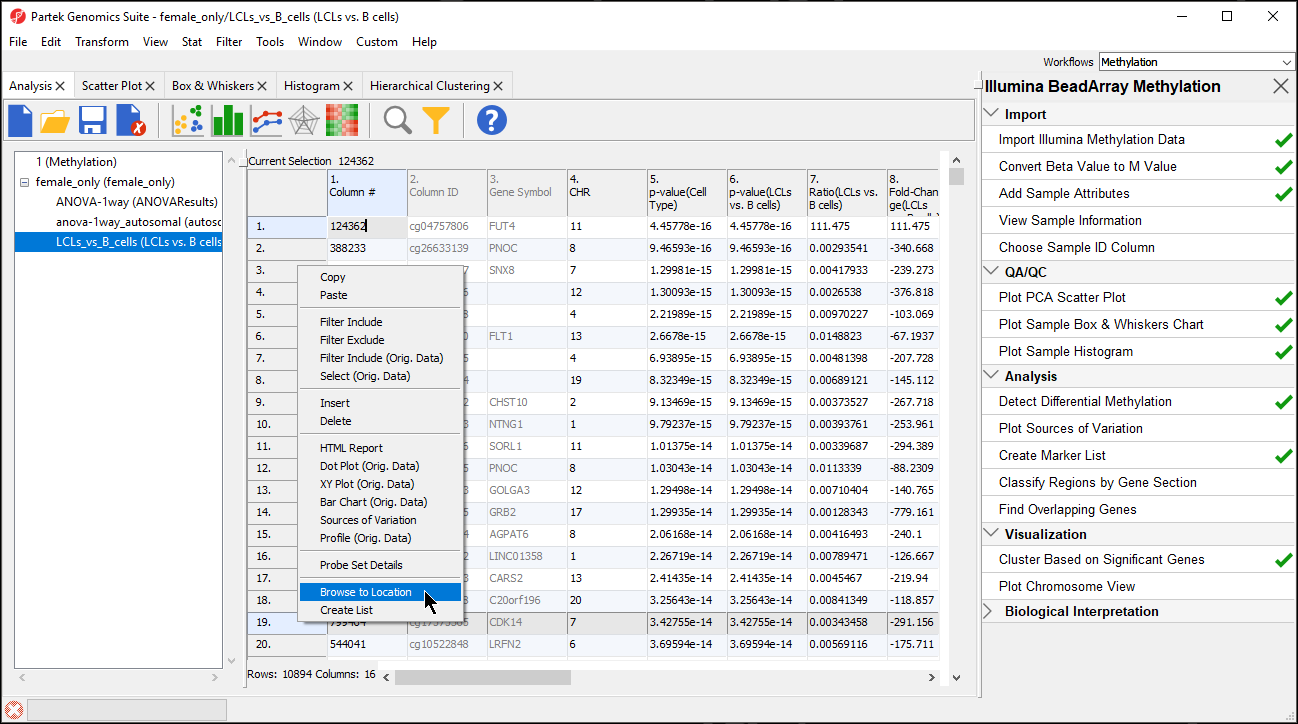 Figure 1. Browsing to location from spreadsheet with differentially expressed genes
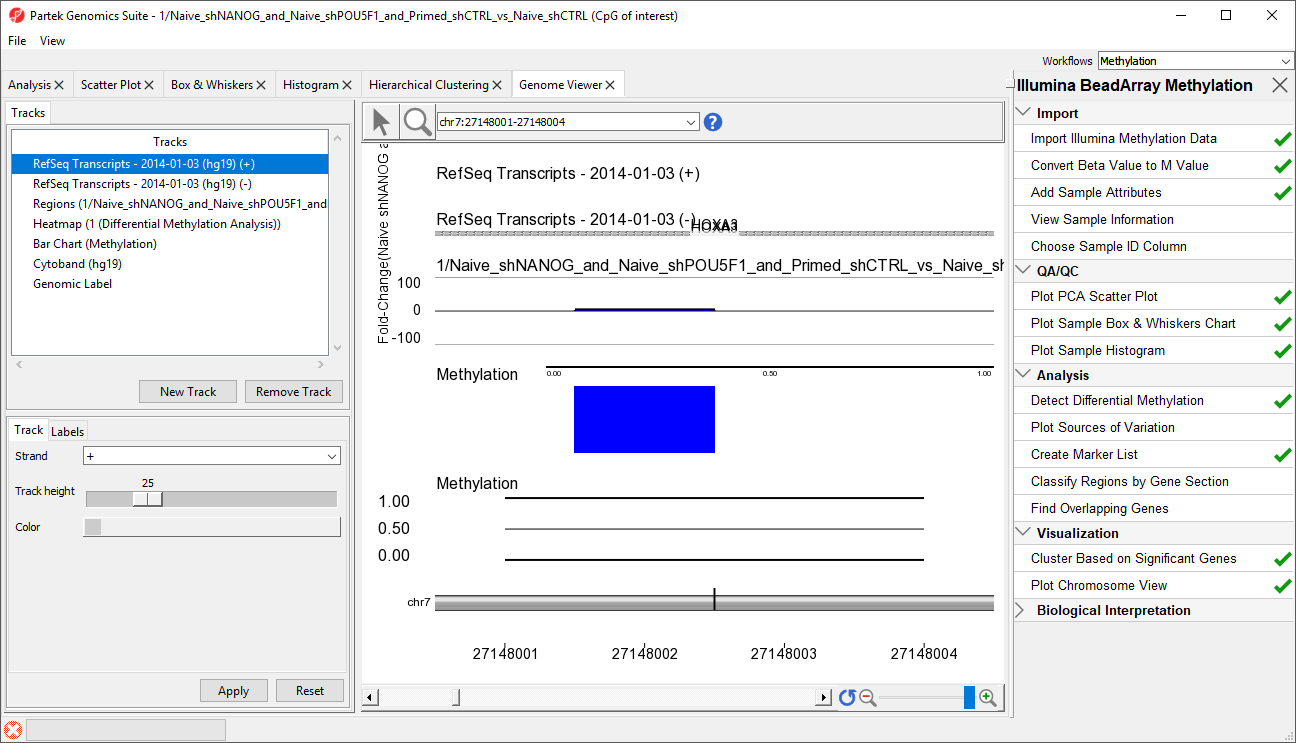 Figure 2. Viewing location in Genome Viewer
The visualization can be supplemented with a special annotation file which can be built using a UCSC annotation file as the basis. Building and viewing the UCSC annotation file is available as an optional section of the tutorial, Optional: Adding UCSC CpG Island Annotations.
Figure 2. Viewing location in Genome Viewer
The visualization can be supplemented with a special annotation file which can be built using a UCSC annotation file as the basis. Building and viewing the UCSC annotation file is available as an optional section of the tutorial, Optional: Adding UCSC CpG Island Annotations.
Additional Assistance
If you need additional assistance, please visit our support page to submit a help ticket or find phone numbers for regional support.


| Your Rating: |
|
Results: |

|
0 | rates |
Overview
Content Tools