During a previous section of this tutorial, a spreadsheet named unexplained_regions was generated. This spreadsheet contains locations where reads map to the genome but are not annotated by the transcript database, in this case, RefSeqGene. The unexplained_regions spreadsheet is potentially very interesting as it may contain novel findings.
- Right click column 6. Average Coverage and select Sort Descending from the menu
- Select Find Overlapping Genes from the Tools option in the command toolbar (Figure 1)
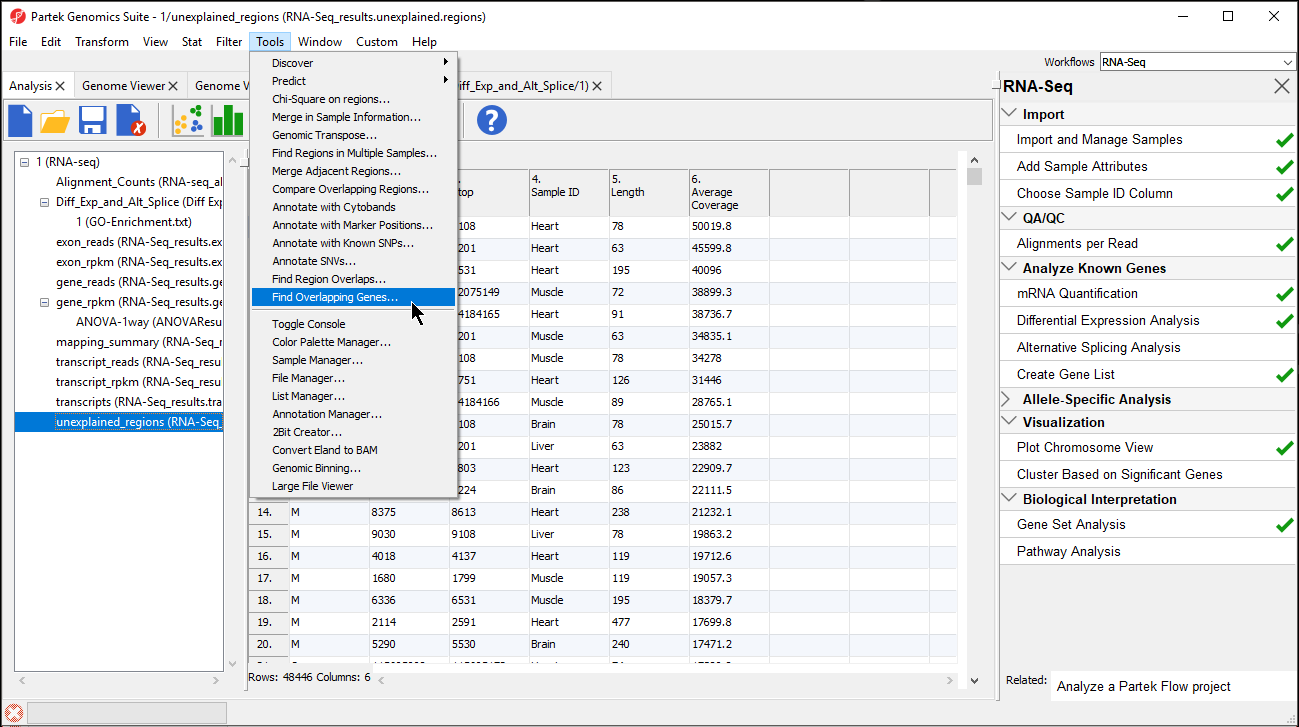
Figure 1. Selecting Find Overlapping Genes from Tools in the command toolbar
- Select Add a new column with the gene nearest to the region in the Find Overlapping Genes dialog (Figure 2)
- Select OK
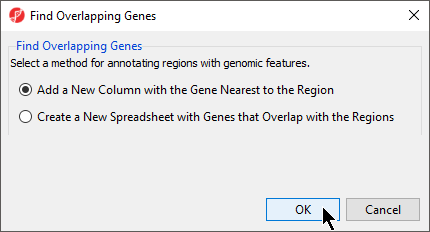
Figure 2. Find Overlapping Genes
- Select RefSeqTranscripts – 2014-01-03 from the Output Overlapping Features dialog (Figure 3)
Please note that it is recommended that you annotate with the same database used when you performed mRNA quantification.
- Select OK
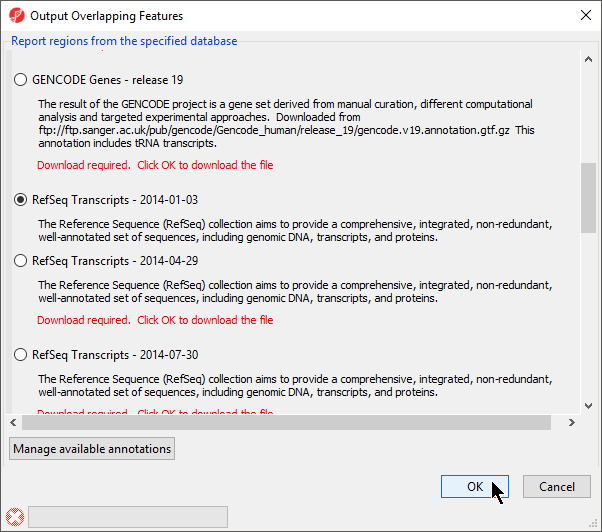
Figure 3. Select the database to search for overlapping features
The closest overlapping feature and the distance to it is now included as columns 7. Overlapping Features and 8. Nearest Features in the unexplained_regions spreadsheet (Figure 4).
Right-clicking on a row header and selecting Browse to Location will show the reads mapped to the chromosome. For this tutorial, a couple of genes are selected to show regions that are located after a known gene or in the intron of a gene.
- With the unexplained_regions spreadsheet open, right-click on Average Coverage (column 6) and select Sort Descending (Figure 5)
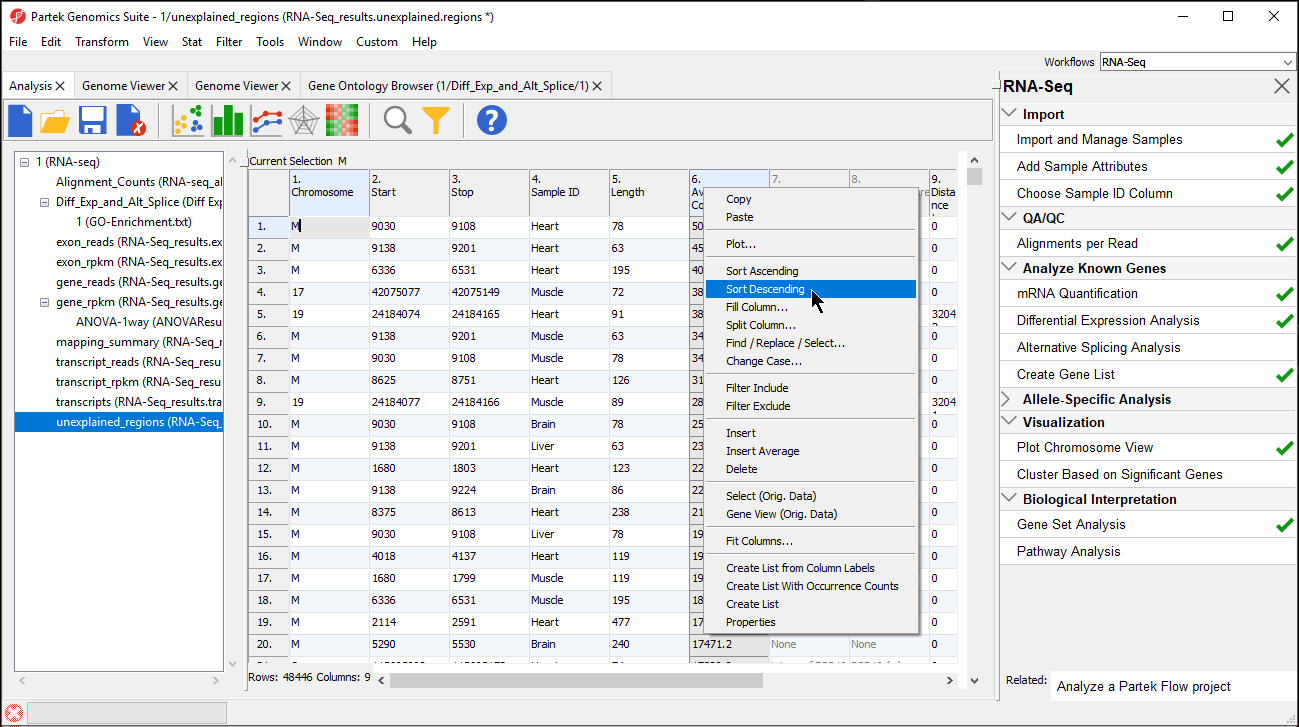
Figure 4. Sorting the unknown_regions spreadsheet by Average Coverage
- Select row 45 and Browse to location to show a region within an intron of UNC45B. This may be a novel exon (Figure 6)
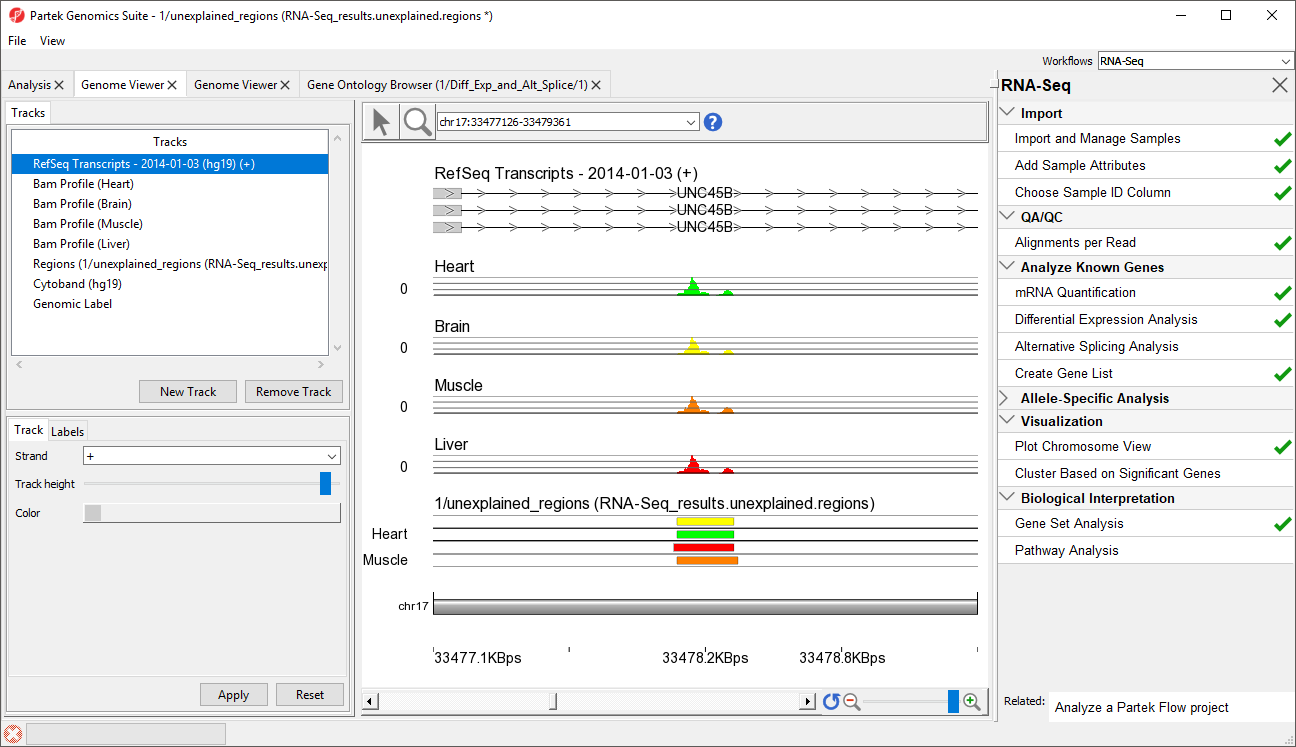
Figure 5. A region within an intron of UNC45B that might be an novel exon
- Select row 10482 and Browse to location to show a region that starts 1 bp after CD82. This peak may represent an extended exon (Figure 7)
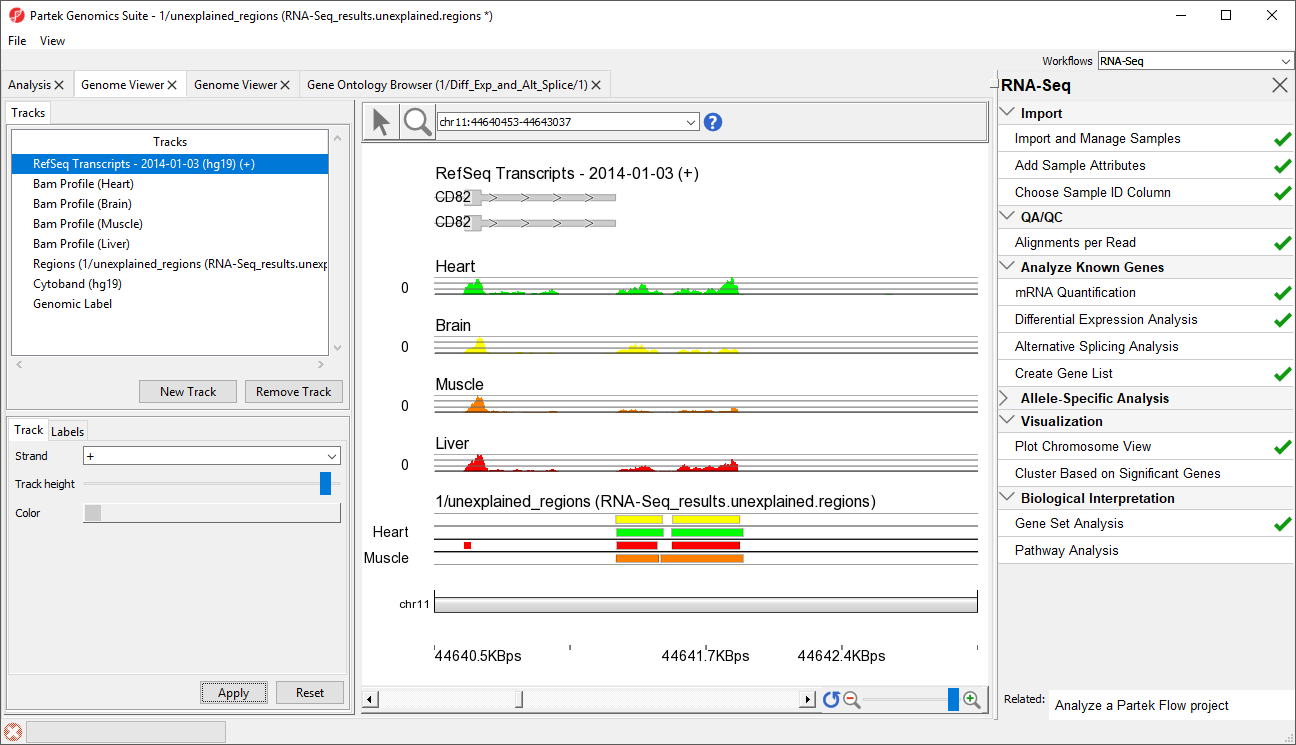
Figure 6. A region that starts 1 bp after CD82 that might represent an extended exon
While RefSeq was used to identify overlapping features, the choice of which database to use will depend on the biological context of your experiment. For example, you may wish to utilize promoter or microRNA databases if you are interested in regulation of expression.
Additional Assistance
If you need additional assistance, please visit our support page to submit a help ticket or find phone numbers for regional support.


| Your Rating: |
|
Results: |

|
0 | rates |
Overview
Content Tools