Once imported, it is possible to visualize the mapped reads along with gene annotation information and cytobands.
- Select the parent spreadsheet 1 (RNA-seq Tutorial)
- Select Plot Chromosome View in the Visualization section of the RNA-seq workflow panel
Unless you have previously downloaded an annotation file (during another experiment), you will be prompted to select an annotation source.
- Select RefSeq Transcripts - 2014-01-03
Partek Genomics Suite will download the relevant file and save it to your default library location. The Genome Viewer tab will open with chromosome 1 displayed (Figure 2)
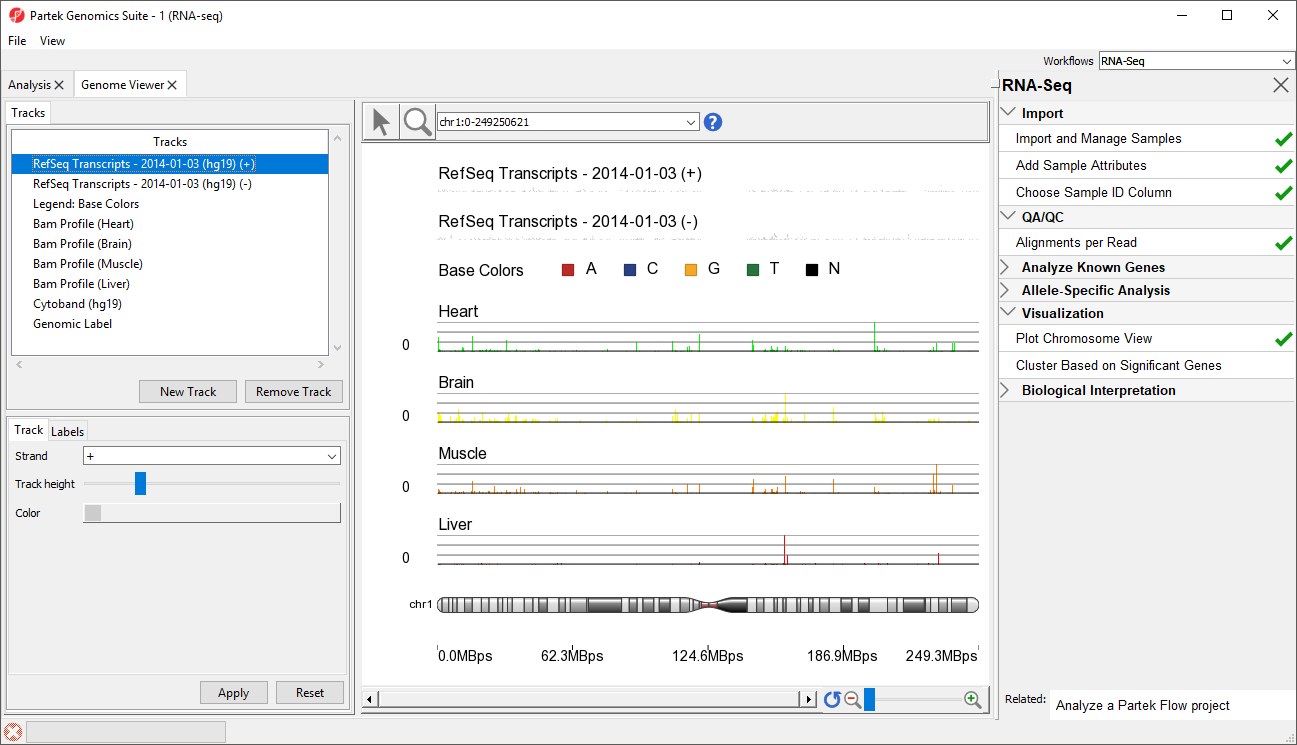
Figure 1. Visualizing reads on a chromosome level in the Genome View
In the Genome Viewer you can choose other chromosomes from the position field drop-down menu (Figure 3) to change which chromosome is displayed. You may also type a search term (e.g. gene symbol or transcript ID) directly into the position field.
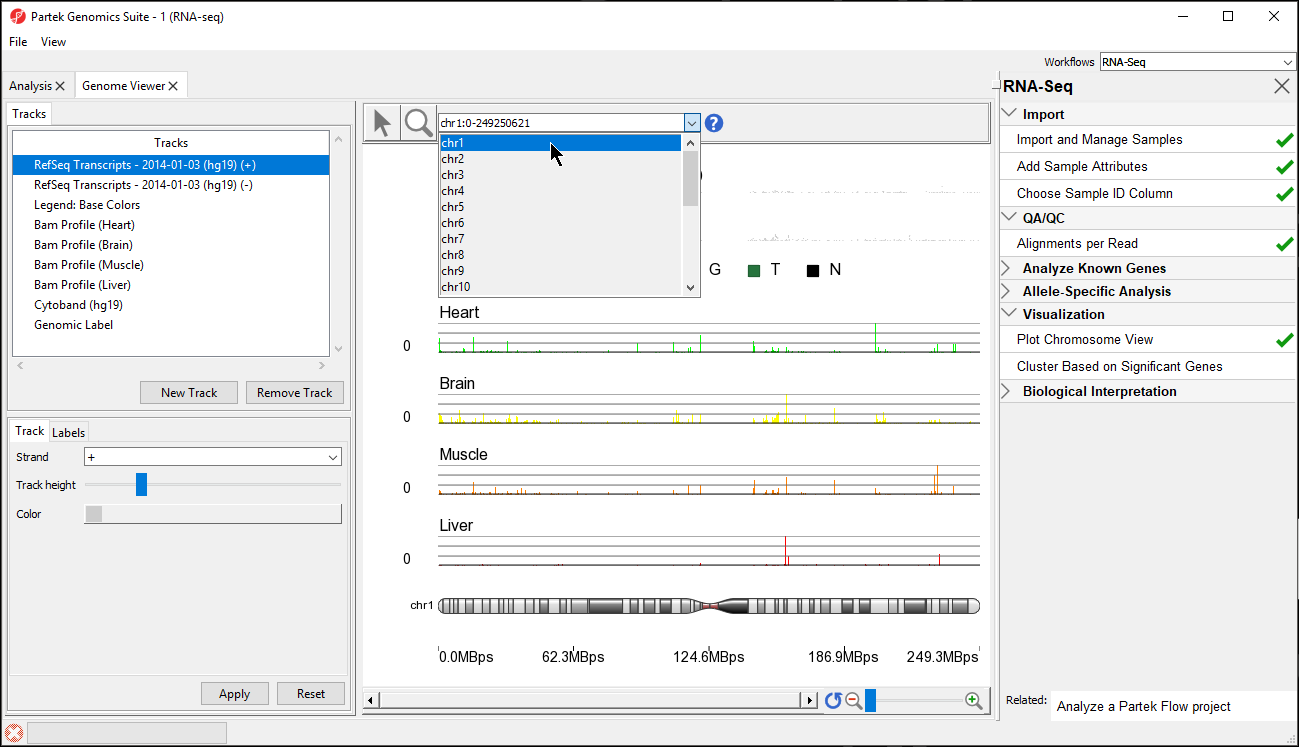
Figure 2. Choosing a chromosome to view in the Genome Viewer
The New Track button allows new tracks to be added to the viewer, while the Remove Track button removes the selected track from the viewer. In the Genome Viewer, select () for selection mode and () for navigation mode. In navigation mode, left-click and draw a box on any track to zoom in. All tracks are synced and will zoom together. Zooming can also be controlled using the interface in the lower right-hand corner of the tab. View can be reset to the whole chromosome level using reset zoom (). Searching for a gene or transcript will also zoom directly to its location.
- Type MYC into the position field at the top of the window
The viewer is now zoomed in to the MYC gene locus (Figure 4).
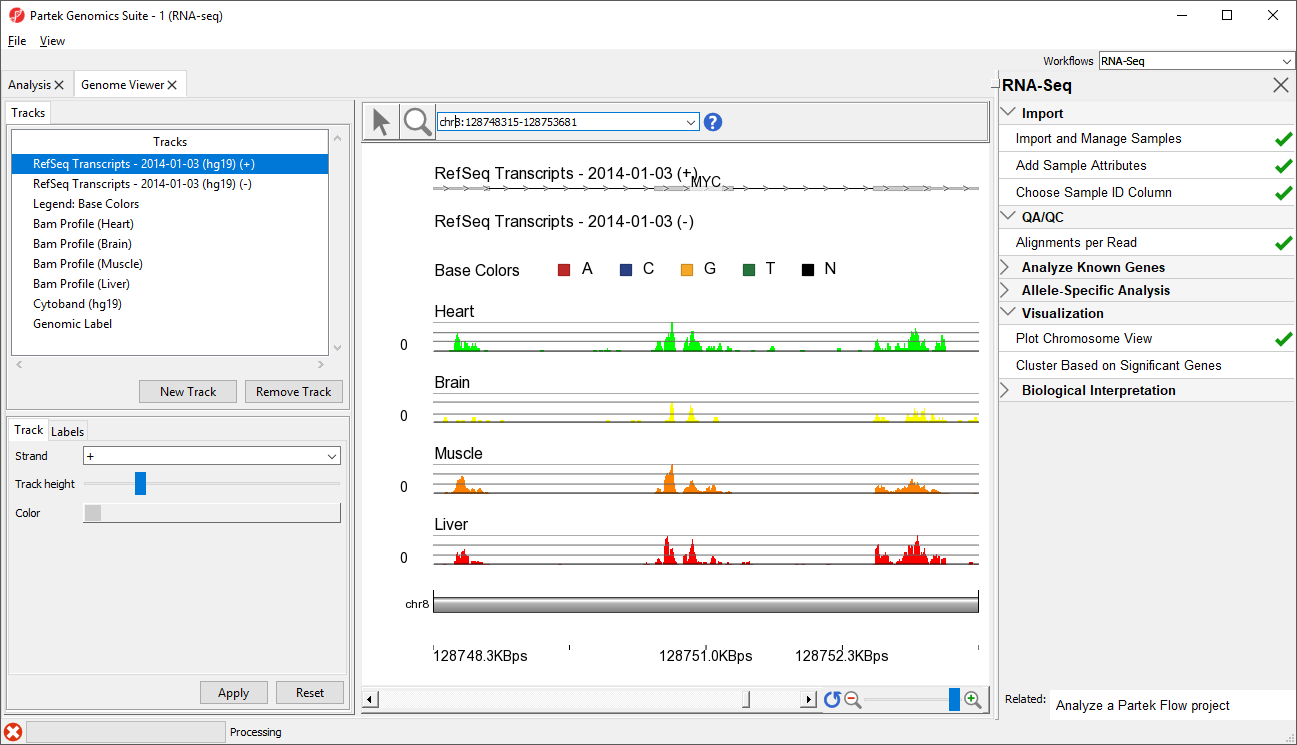
Figure 3. Zooming to look at a gene of interest (MYC)
Additional Assistance
If you need additional assistance, please visit our support page to submit a help ticket or find phone numbers for regional support.


| Your Rating: |
|
Results: |

|
0 | rates |
Overview
Content Tools