Page History
| Table of Contents | ||||||
|---|---|---|---|---|---|---|
|
The Non-parametric ANOVA task uses the Kruskal-Wallis and Dunn's tests (Non-parametric ANOVA) task is used to identify deferentially expressed genes among two or more groups. Note that such rank-based tests are generally advised for use with larger sample sizes.
Running the task
To invoke the NonKruskal-parametric ANOVAWallis test, select any count-based data nodes, these include:
- Gene counts
- Transcript counts
- Normalized counts
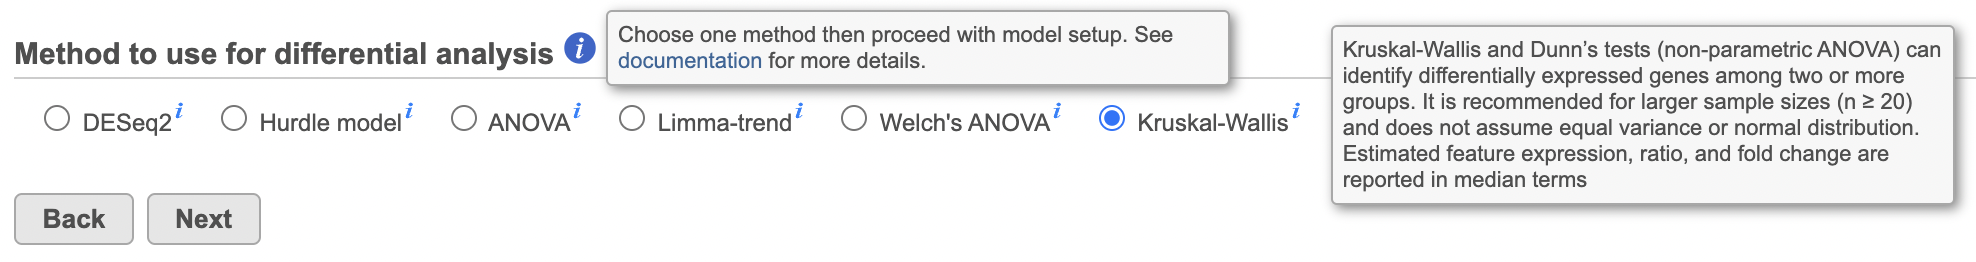
Select Non-parametric ANOVA under the Statistical analysis section of the context Statistics > Differential analysis in the context-sensitive menu, then select Kruskal-Wallis (Figure 1).
| Numbered figure captions | ||||
|---|---|---|---|---|
|
...
|
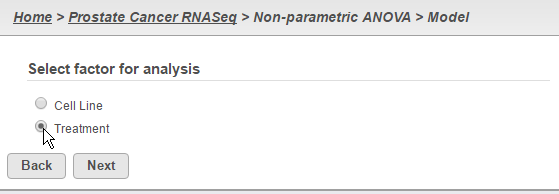
Select a specific factor for analysis and click the Next button (Figure 2). Note that this task can only take into account one factor at a time.
| Numbered figure captions | ||||
|---|---|---|---|---|
| ||||
|
For more complicated experimental designs, go back to the original count data that will be used as input and perform Rank normalization at the Features level (Figure 3). The resulting Normalized counts data node can then be analyzed using the Detect differential expression (ANOVA) task, which can take into account multiple factors as well as interactions.
| Numbered figure captions | ||||
|---|---|---|---|---|
| ||||
|
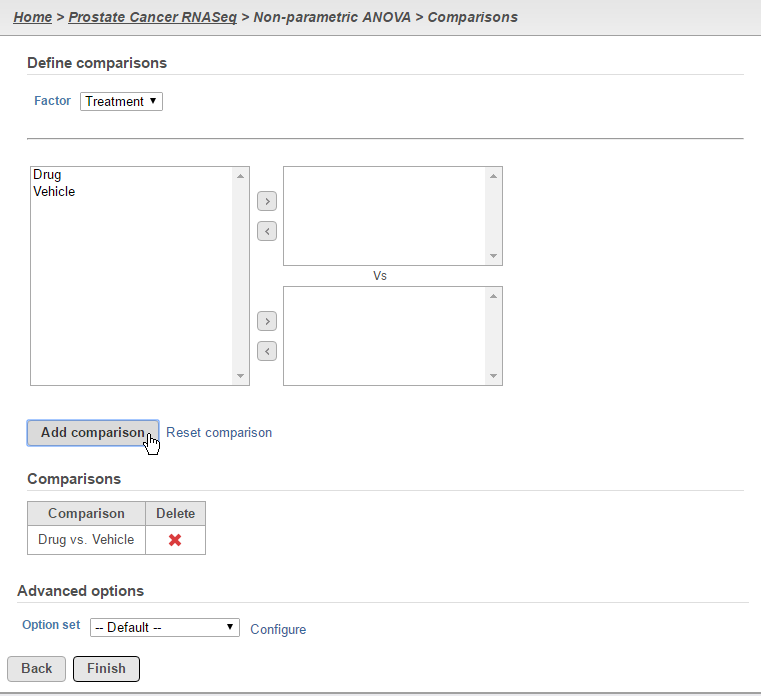
Define the desired comparisons between groups and click the Finish button (Figure 4). Note that comparisons can only be added between single group (i.e. one group per box).
| Numbered figure captions | ||||
|---|---|---|---|---|
| ||||
|
...
Report
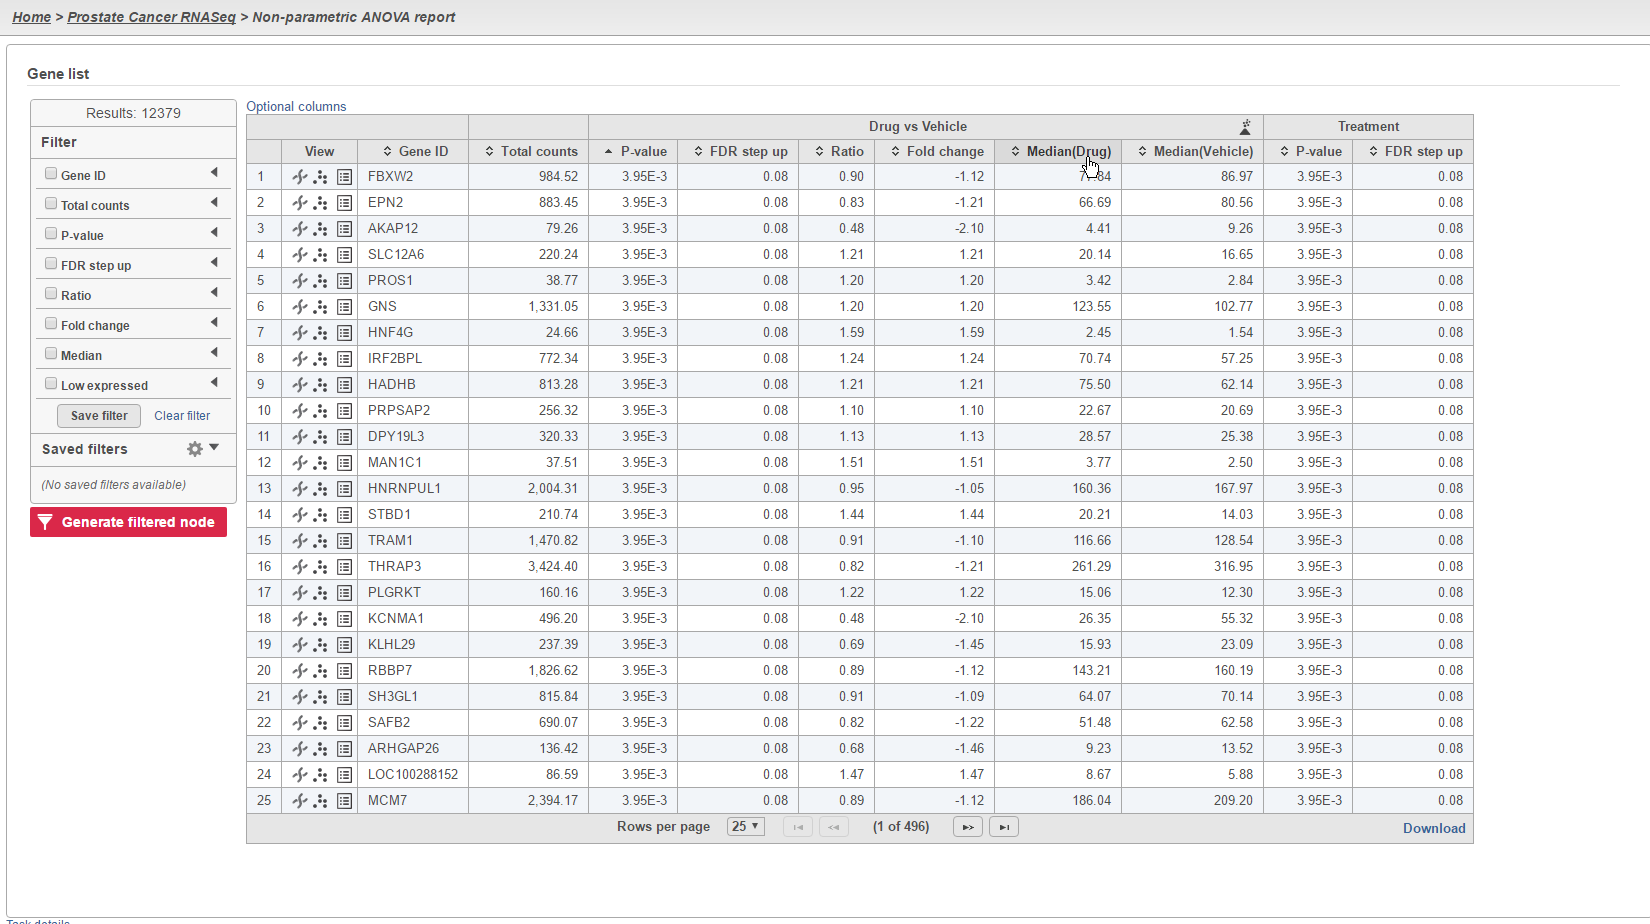
The results of the analysis will appear similar to other differential expression analysis results. However, the column to indicate mean expression levels for each group will display the median instead (Figure 5).
| Numbered figure captions | ||||
|---|---|---|---|---|
| ||||
|
...
...
| Additional assistance |
|---|
| Rate Macro | ||
|---|---|---|
|
...
Overview
Content Tools