Page History
This normalization is performed on observations (samples) using internal control features (genes). The internal control features, usually housekeeping genes, should not vary among samples[1]. The implementation implementation details is as follows:
1. Compute geometric mean of all the control genes (features) e.g. (g1 to gm) in each sample S (f means feature, S means sample, 1-m are control features), represented by GS1 to GSn (n number of samples).
2. Compute geometric mean of across all samples (GS1 to GSn), represented by GS
3. Compute the scaling factor for each sample, S1=GS1/GS, S2=GS2/GS ... Sn=GSn/GS
4. Normalize all the gene expression by divided by its sample scaling factor
Note: The input data node must contain all positive values to compute geometric mean.
...
| Numbered figure captions | ||||
|---|---|---|---|---|
| ||||
|

There are three options to choose the baseline samples:
- use all samples
- use a group
- use matched pairs
Use all samples to create baseline
To normalize data to all the samples, choose to calculate the baseline using the mean or median of all samples for each feature, and choose to subtract baseline or ratio to baseline for the normalization method (Figure 2), and click Finish.
| Numbered figure captions | ||||
|---|---|---|---|---|
| ||||
|

...
| Numbered figure captions | ||||
|---|---|---|---|---|
| ||||
|

Choose use group, select the attribute containing the baseline group information, e.g. Treatment in this example, with the samples with the group Control for the Treatment attribute used as the baseline. The control samples can be filtered out after normalization by selecting the Remove baseline samples after normalization check box.
Use matched pairs
When using matched pairs, one sample from each pair serves as the control. An attribute specifying the pairs must be selected in addition to an attribute designating which sample in each pair is the baseline sample (Figure 4).
| Numbered figure captions | ||||
|---|---|---|---|---|
| ||||
|

After normalization, all values for the control sample will be either 0 or 1 depending on the normalization method chosen, so we recommend removing baseline samples when using matched pairs.
The output of Normalize to baseline is a Normalized counts data node.
|
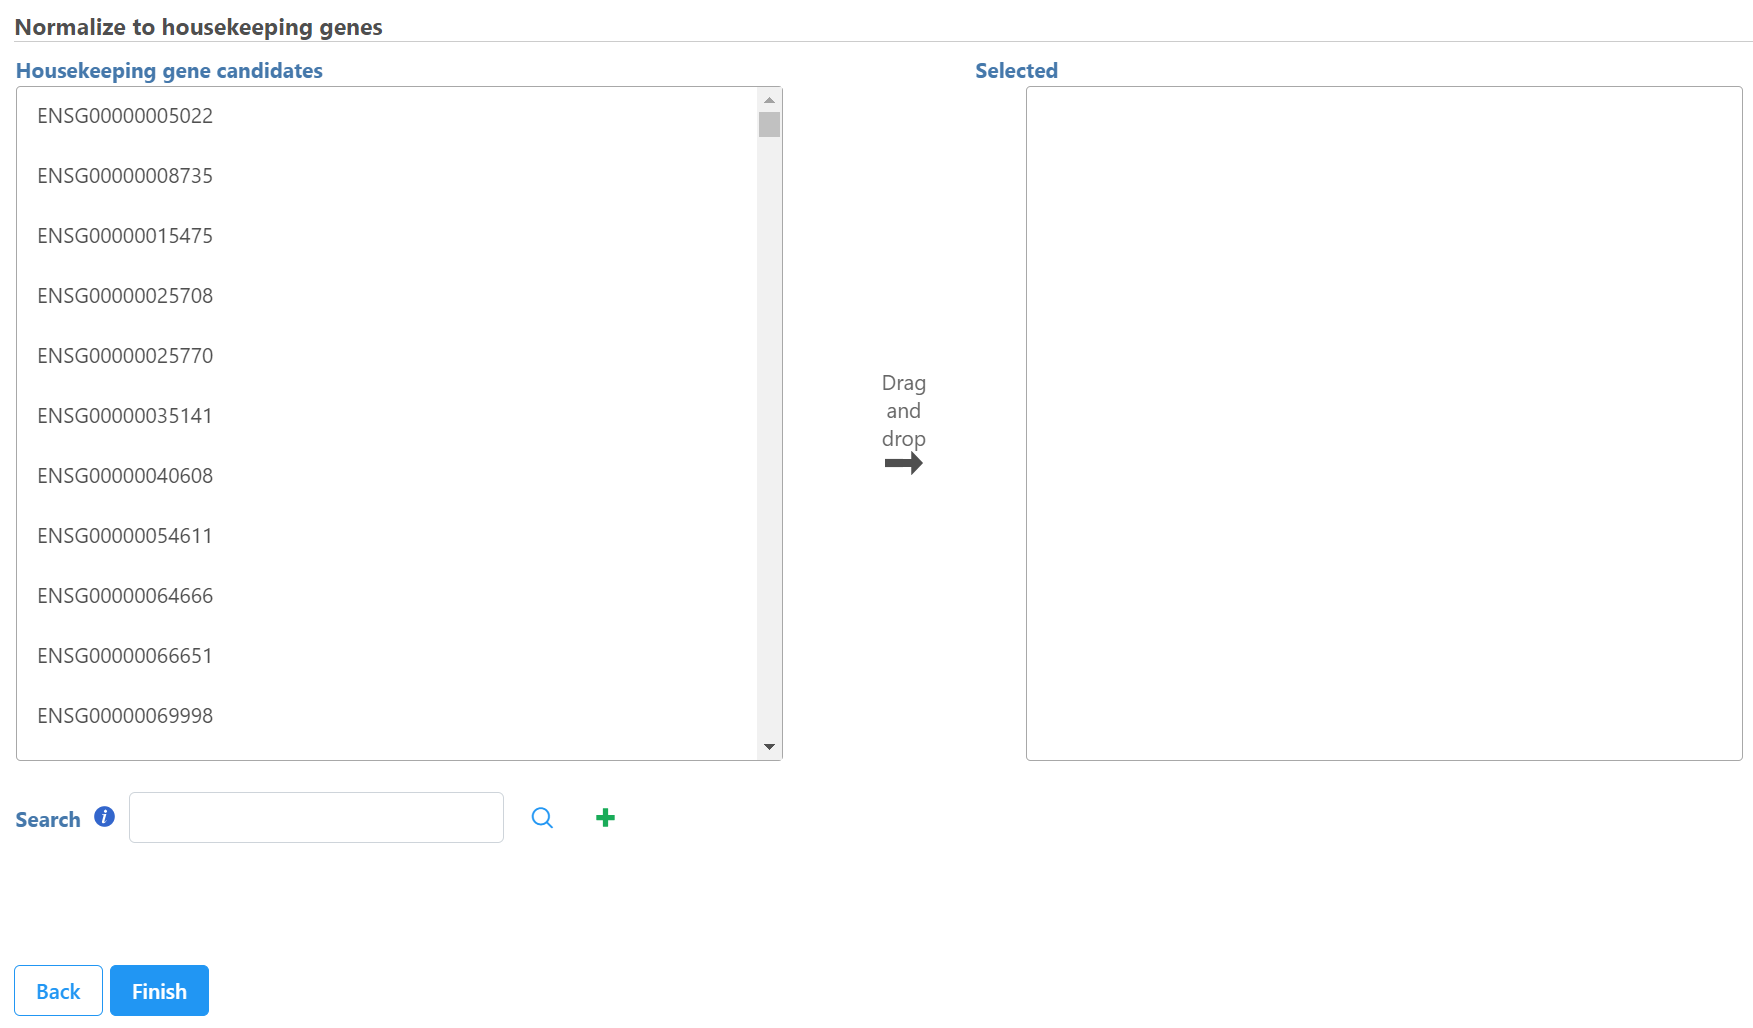
Select control genes on the left panel and move them to the right panel. You can also use search box to find the feature and click on the ![]() to add it to the right panel.
to add it to the right panel.
Click Finish
References
- Frank Speleman. Accurate normalization of real-time quantitative RT_PCR data by geometric averaging of multiple internal control genes. Genome Biology. 2002.
| Additional assistance |
|---|
| Rate Macro | ||
|---|---|---|
|
Overview
Content Tools