Page History
...
| Numbered figure captions | ||||
|---|---|---|---|---|
| ||||
|
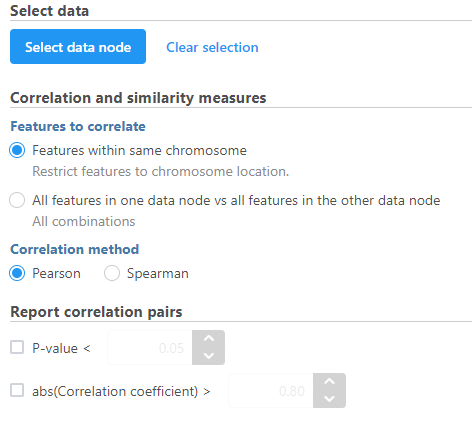
Correlation across assays analysis options
Correlation and similarity measures
Features within same chromosome: this option will restrict feature comparison to the chromosome location
All features in one data node vs all features in the other data node: this option will perform the comparison using all combinations without location constraint
Pearson: linear correlation: 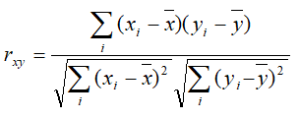
Spearman: rank correlation: 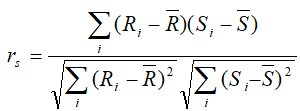
Report correlation pairs
P-value: select a cut-off value for significance and only those pairs that meet the criteria will be reported
abs(Correlation coefficient):
magnitude of correlation (represented by the symbol r); the greater the absolute value the stronger the correlation
A perfect linear relationship yields a correlation coefficient of +1 (or -1 for a negative relationship) and no linear relationship yields a correlation coefficient of 0.
- Compute the absolute value of the correlation coefficient between two variables
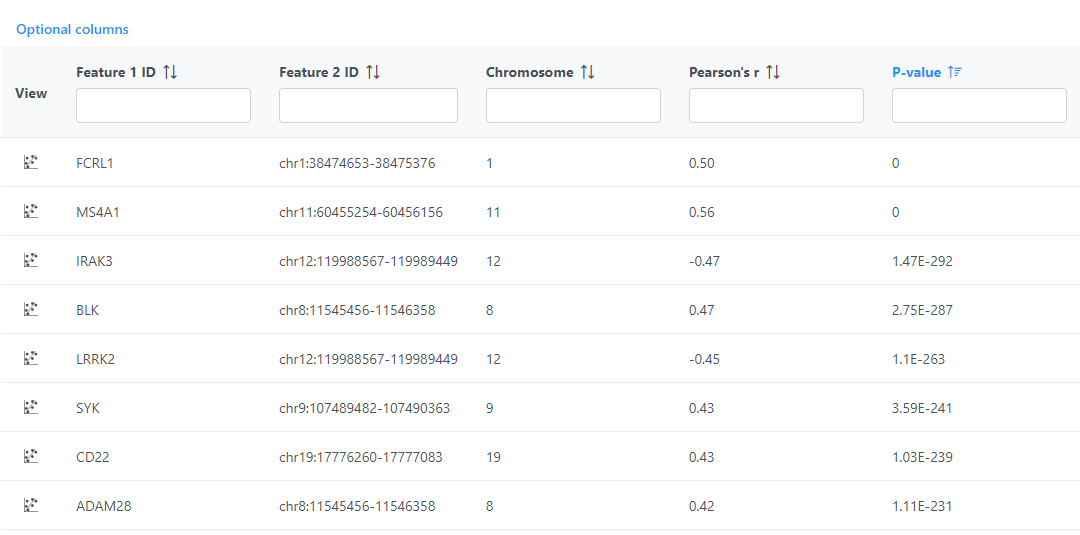
Correlation across assays produces a Correlation pair list data node; double-click to open the table (Figure 5). The table can be sorted and filtered using the column titles.
...
| Numbered figure captions | ||||
|---|---|---|---|---|
| ||||
|
...
Overview
Content Tools