Page History
...
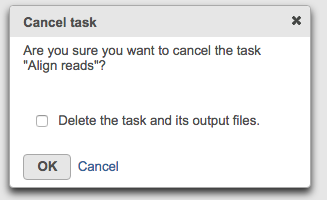
A verification dialog will appear (Figure 9) with the option to Delete the task and its output files. If this is selected, the pending tasks and data nodes will disappear. if this is not selected, the cancelled tasks will remain in the Analyses tab but will be flagged by gray x circles on the nodes (Figure 10).
| Numbered figure captions | ||||
|---|---|---|---|---|
| ||||
Data nodes connected to incomplete tasks are also incomplete as no output can be generated (Figure 10). Failed tasks may appear similarly but wi failure due to errors, , to get more information see the Task details.
| Numbered figure captions | ||||
|---|---|---|---|---|
| ||||
...
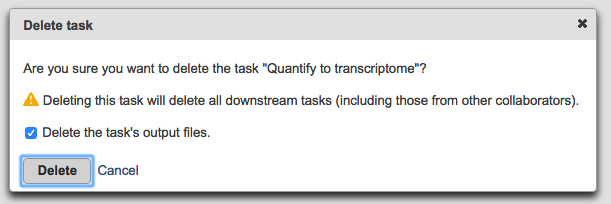
A verification dialog will appear (Figure 12). A yellow warning sign will show up if there some downstream tasks performed by collaborators will be affected. Deleting the tasks output files optional. If this is not selected, the task nodes will disappear from the Analyses tab but the output files will remain in the project output directory.
| Numbered figure captions | ||||
|---|---|---|---|---|
| ||||
Task Results and Task Actions
...
The Task details shows detailed diagnostic information about the task (Figure 1315). It includes the duration and parameters of the task, lists of input and output files, and the actual commands (in the command line) that were run.
...
Another action available for a task node is Add task description (Figure 1416), which is a way to add notes to the project. The user can enter a description, which will be displayed when the mouse pointer is hovered over the task node.
...
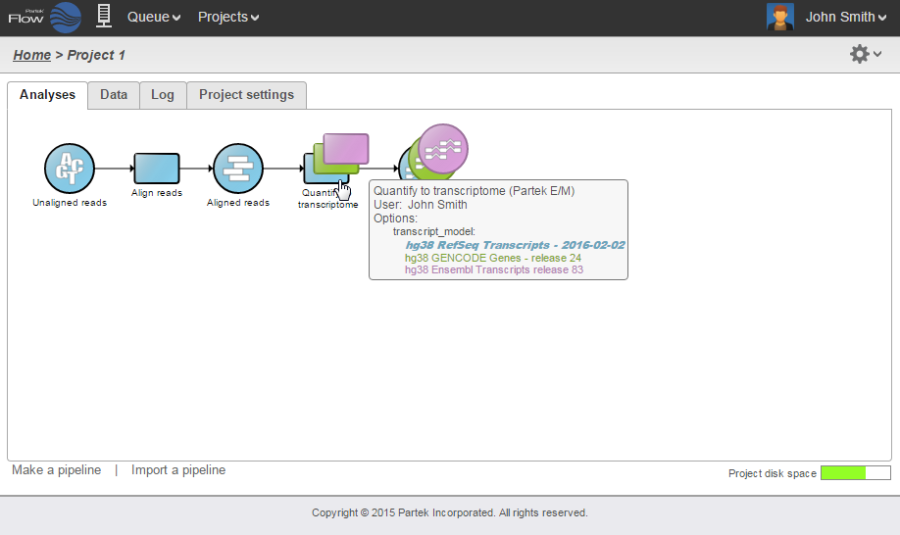
The implementation of Layers makes optimizations easy and organized. Instead of creating separate nodes in a pipeline, another set of nodes with a different color is stacked on top of previous analyses (Figure 1517). To see the parameters that were changed between runs, hover the mouse icon over the set of stacked task nodes and a pop-up balloon will display them. The text color signifies the layer corresponding to a specific parameter.
| Numbered figure captions | ||||
|---|---|---|---|---|
| ||||
...
Data associated with any data node can be downloaded using the Download data link in the context sensitive menu (Figure 1618). Compressed files will be downloaded to the local computer where the user is accessing the Partek Flow server. Note that bigger files (such as unaligned reads) would take longer to download. For guidance, a file size estimate is provided for each data node. These zipped files can easily be imported by the Partek® Genomics Suite® software.
...
The lower right corner of the Analyses tab shows the Project disk space icon. Mouse over the icon to get information about the total space and usage available for your project (Figure 1719). The icon changes color from green to red as the used space gets closer to the total space (green < 80%, yellow < 90%, red >= 90%).
...


