Page History
...
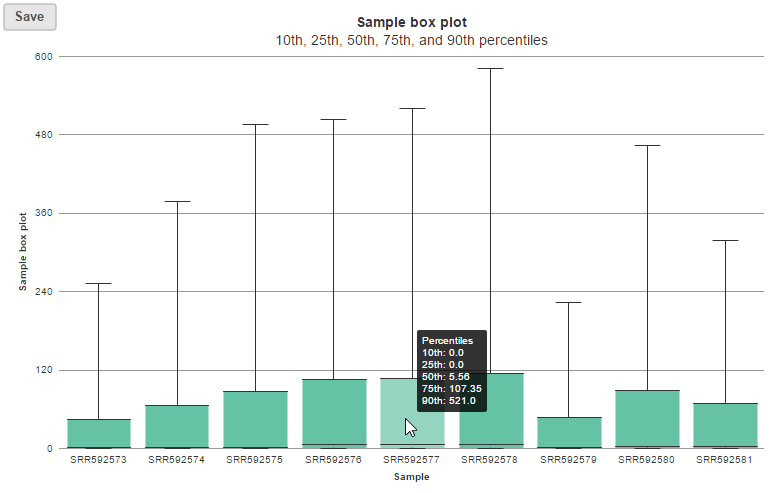
In the box-whisker plot, each box is a sample on X-axis, the box represents 25th and 75th percentile, the whiskers represent 10th and 90th percentile, Y-axis represents the read counts, when you hover over each box, detailed sample information is displayed (Figure 8).
| Numbered figure captions | ||||
|---|---|---|---|---|
| ||||
|
In sample histogram, each line represents a sample and the range of read counts are divided into 20 bins. Clicking on a sample in the legend will hide the line for that specific sample. Hovering over each circle displays detailed information about the sample and that specific bin (Figure 9). The information includes:
...
Overview
Content Tools