Page History
...
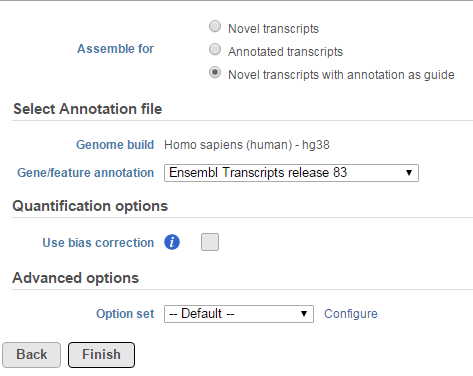
The Cufflinks task has three options that can be configured (Figure 111):
| Numbered figure captions | ||||
|---|---|---|---|---|
| ||||
|
...
When the Use bias correction check box is selected, it will use the genome sequence information to look for overrepresented sequences and improve the accuracy of transcript abundance estimates.
Quantify to reference (Partek E/M)
This task does not need an annotation model file, since the annotation is retrieved from the BAM file itself. The sequence names in the BAM files constitute the features with which the reads are quantified against.
This task is generally performed on reads aligned to a transcriptome, e.g when a species does not have a genome reference, and the bam files contain transcriptome information. In this case, the features for this quantification task are the reference sequence names in the input bam files.
There are two parameters in Quantify to reference (Figure 12):
| Numbered figure captions | ||||
|---|---|---|---|---|
| ||||
- Min coverage: will filter out any features (sequence names) that have fewer reads across all samples than the value specified
- Strict paired-end compatibility: this only affects paired end data. When it is checked, only reads that have two ends aligned to the same feature will be counted. Otherwise, reads will still be counted as exonic compatible reads even if the mate is not compatible with the feature
During quantification:
- We scan through each of the BAM files and find all the transcripts that meet the minimum coverage threshold.
- With those transcripts, we "create" an annotation file that has the transcript name as the sequence name and the Gene ID and the Transcript ID have the same transcript name. The start position is 1 and the end position is the length of the transcript.
- Effectively, what the annotation file does is filter out the low coverage transcripts.
- Since we don't know where the transcripts are in the genome, chromosome view will display only one transcript at a time (i.e., the transcript names are treated like "chromosomes").
The output data node will display a similar Task report as the Quantify to annotation model task.
References
- Trapnell C, Williams B, Pertea G, et al. Transcript assembly and quantification by RNA-Seq reveals unannotated transcripts and isoform switching during cell differentiation. Nature Biotech. 2010; 28:511-515.
Xing Y, Yu T, Wu YN, Roy M, Kim J, Lee C. An expectation-maximization algorithm for probabilistic reconstructions of full-length isoforms from splice graphs. Nucleic Acids Res. 2006; 34(10):3150-60.
| Additional assistance |
|---|
|
| Rate Macro | ||
|---|---|---|
|
Overview
Content Tools