Page History
...
| Numbered figure captions | ||||
|---|---|---|---|---|
| ||||
|
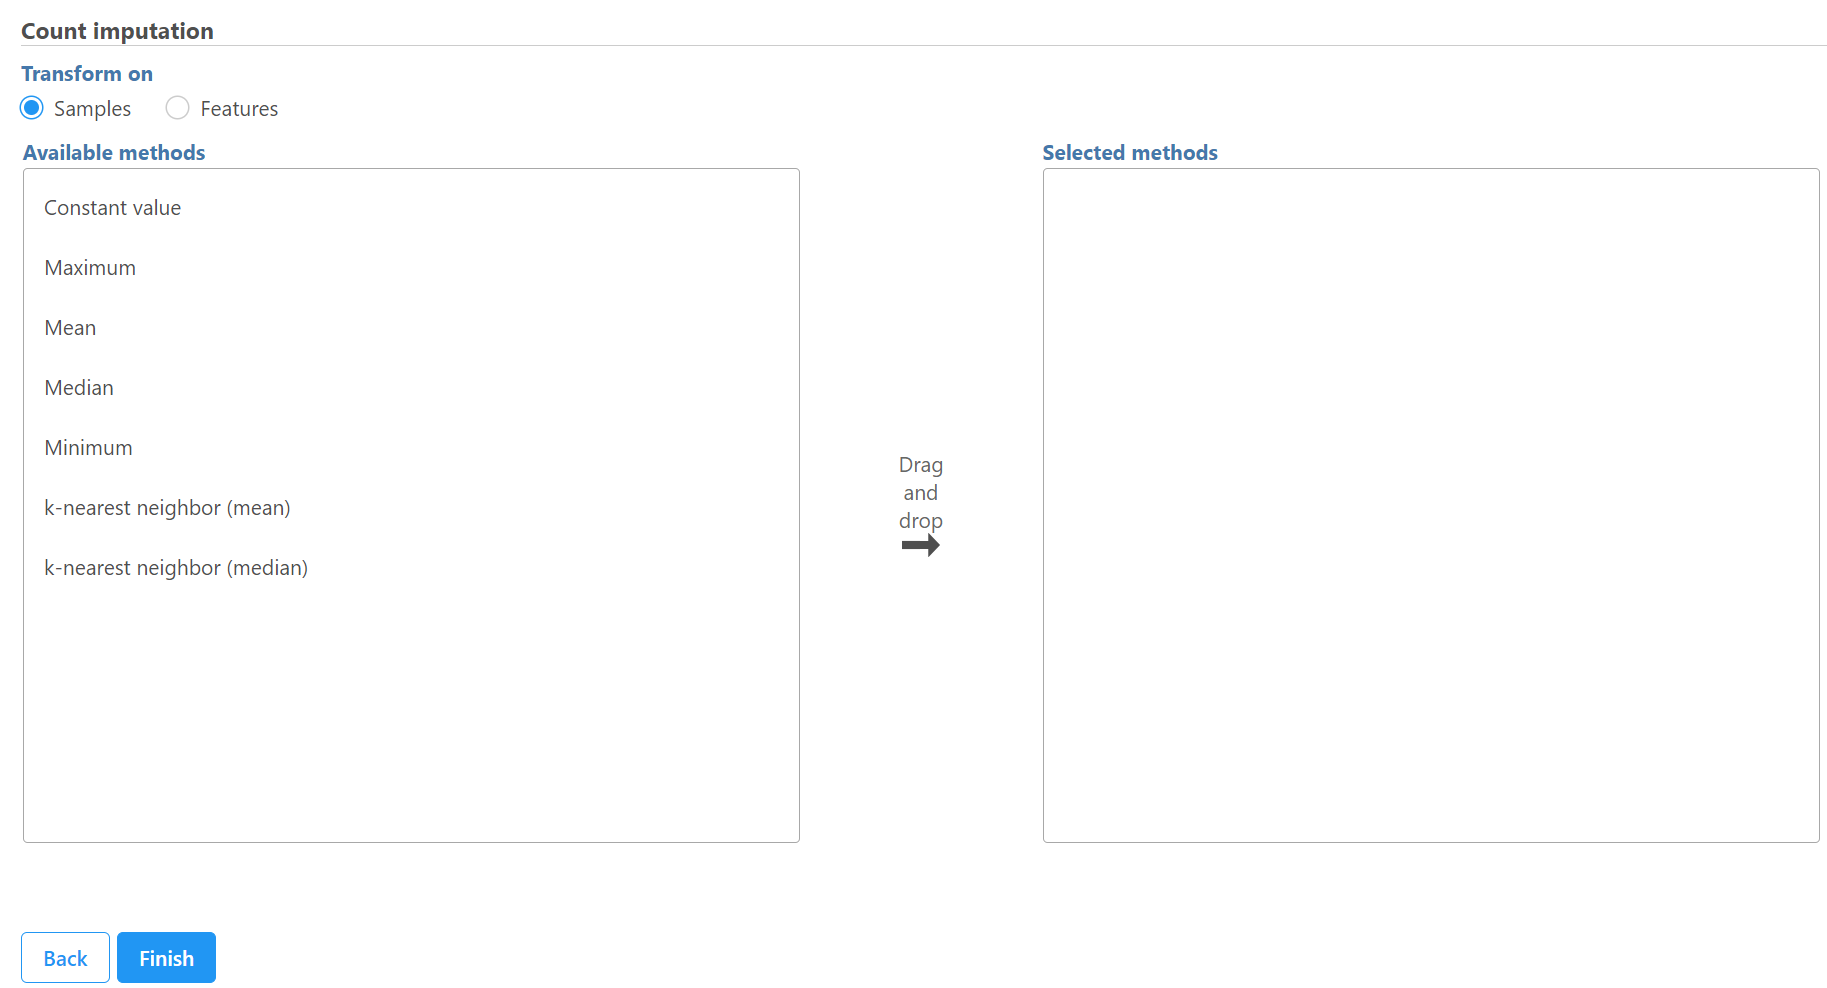
First select the computation is based on samples/cells or features, and click Finish to replace missing values. Some functions will generate the same results no matter which transform option is selected, e.g. constant value. Others will generate different results:
- Constant values: specify a value to replace the missing data
- Maximum: use maximum value of samples/cells or features to replace missing data depends transform option
- Mean: use mean value of samples/cells or features to replace missing data depends transform option
- Median: use median value of samples/cells or features to replace missing data depends transform option
Use all samples to create baseline
To normalize data to all the samples, choose to calculate the baseline using the mean or median of all samples for each feature, and choose to subtract baseline or ratio to baseline for the normalization method (Figure 2), and click Finish.
| Numbered figure captions | ||||
|---|---|---|---|---|
| ||||
|

...
| Numbered figure captions | ||||
|---|---|---|---|---|
| ||||
|

Choose use group, select the attribute containing the baseline group information, e.g. Treatment in this example, with the samples with the group Control for the Treatment attribute used as the baseline. The control samples can be filtered out after normalization by selecting the Remove baseline samples after normalization check box.
Use matched pairs
When using matched pairs, one sample from each pair serves as the control. An attribute specifying the pairs must be selected in addition to an attribute designating which sample in each pair is the baseline sample (Figure 4).
| Numbered figure captions | ||||
|---|---|---|---|---|
| ||||
|

After normalization, all values for the control sample will be either 0 or 1 depending on the normalization method chosen, so we recommend removing baseline samples when using matched pairs.
...
- Minimum: use minimum value of samples/cells or features to replace missing data depends transform option
- K-nearest neighbor (mean): specify number of neighbors (N), Euclidean metric is used to compute neighbors, use mean of (N) neighbors to replace missing data
- K-nearest neighbor (median): specify number of neighbors (N), Euclidean metric is used to compute neighbors, use median of (N) neighbors to replace missing data
| Additional assistance |
|---|
| Rate Macro | ||
|---|---|---|
|
Overview
Content Tools