Page History
...
| Numbered figure captions | ||||
|---|---|---|---|---|
| ||||
|


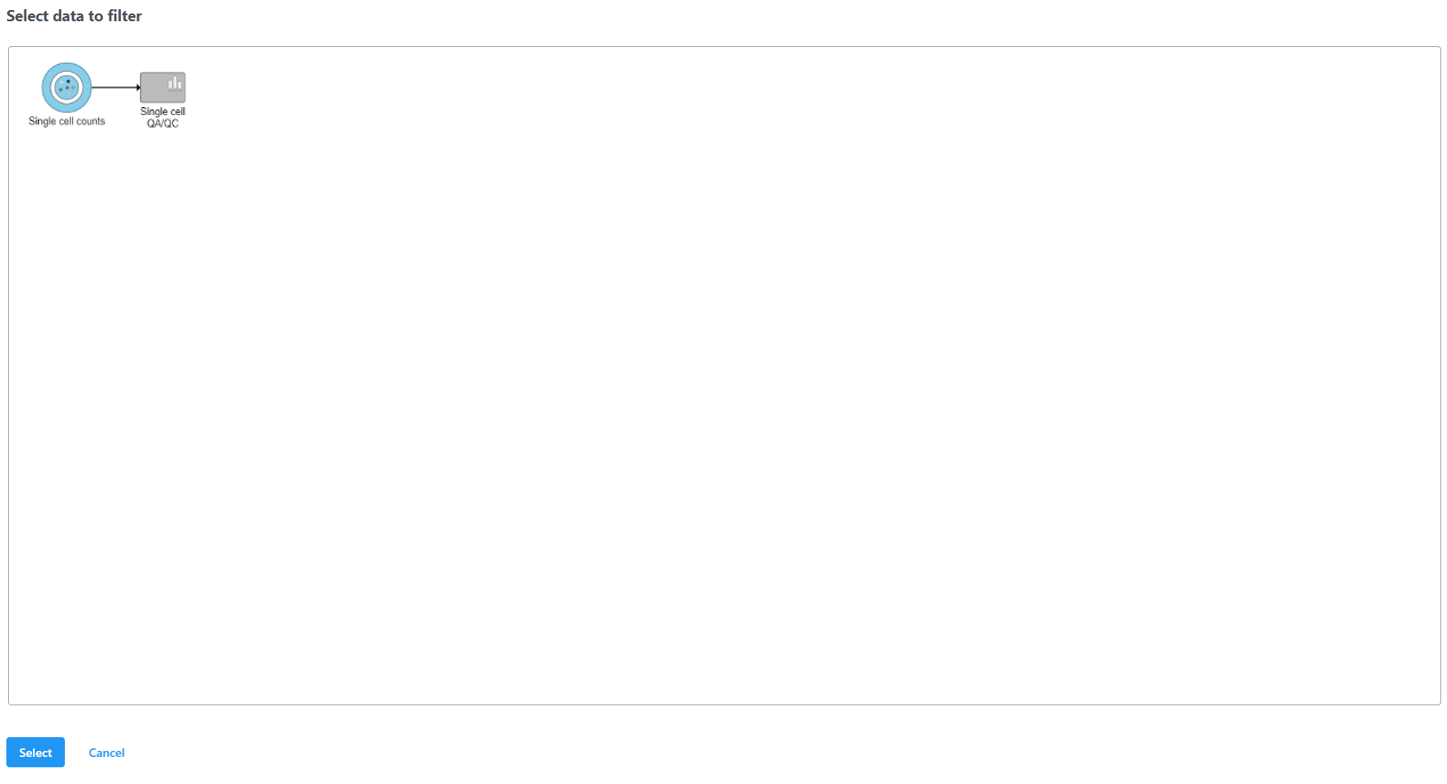
To filter the high-quality cells, click the icon in Filter in the top right of Select & Filter, and click Apply observation filter... (Figure 9).
...
| Numbered figure captions | ||||
|---|---|---|---|---|
| ||||
|
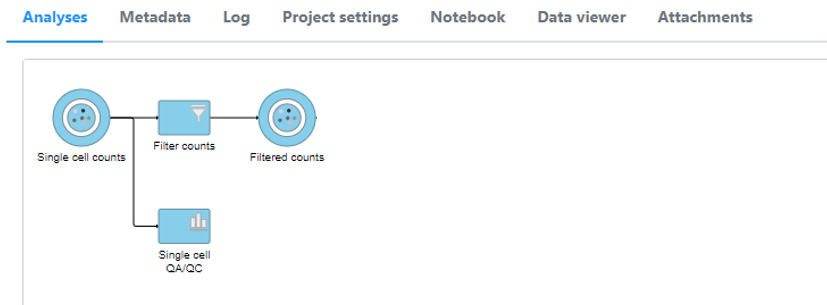
A new data node, Filtered counts, will be generated under the Analyses tab (Figure 11).
...
| Numbered figure captions | ||||
|---|---|---|---|---|
| ||||
|
Double click the Filtered counts data node to view the task report. The report includes a summary of the count distribution across all features for each sample; a detailed breakdown of the number of cells included in the filter for each sample; and the minimum and maximum values for each quality metric (expressed genes, total counts, etc) across the included cells for each sample (Figure 12).
...
Overview
Content Tools