Page History
...
Detailed configuration on PCA plot can be found by clicking Help>How-to videos>Data viewer section.
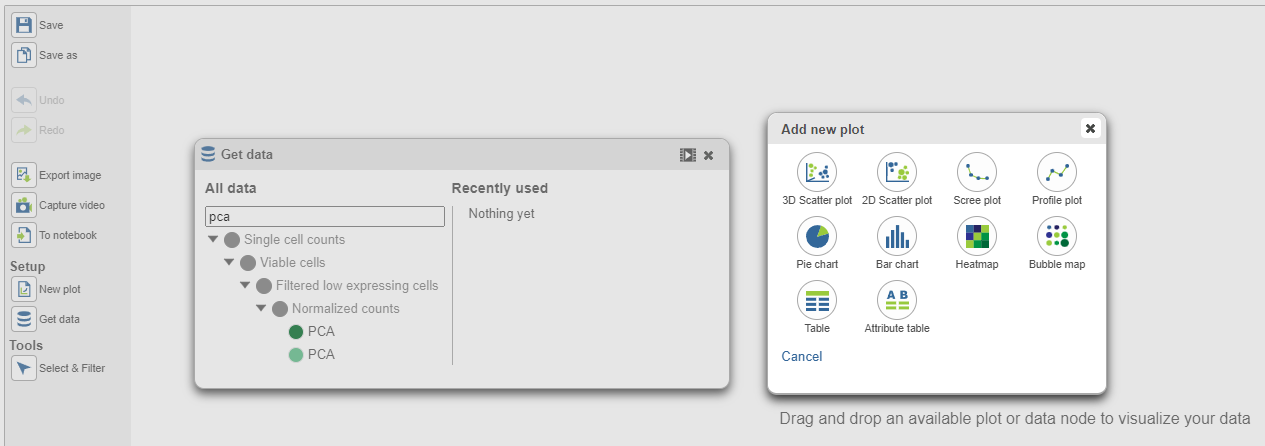
In Data viewer, when select a PCA data node is the Data section on the control panel selected from Get Data under Setup (left panel), when drag the node can be dragged and dropped to the plot section screen (Figure 3), then you will have the option to plot select a scree plot and tables.
| Numbered figure captions | ||||
|---|---|---|---|---|
| ||||
  |
When choose Scree plot icon ![]() , it will plot a 2D viewer, X-axis represents PCs, Y-axis represents eigenvalues (Figure 4)
, it will plot a 2D viewer, X-axis represents PCs, Y-axis represents eigenvalues (Figure 4)
...
Overview
Content Tools