Page History
...
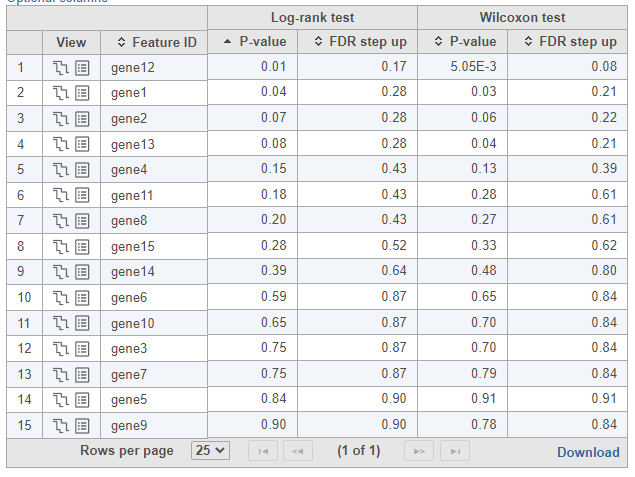
To see whether the survival curves are statistically different, Kaplan-Meier task runs Log-rank and Wilcoxon (aka Wilcoxon-Gehan) tests. The null hypothesis is that the survival curves do not differ among the groups (the computational details are available in [2]). When feature expression is used, the p-values are also feature specific (Figure 3). Select the step-plot icon under View to visualize the Kaplan-Meier survival curves for each gene.
| Numbered figure captions | ||||
|---|---|---|---|---|
| ||||
|
...
Overview
Content Tools