Page History
...
| Numbered figure captions | ||||
|---|---|---|---|---|
| ||||
|
UMAP
Similar to t-Distributed Stochastic Neighbor Embedding (t-SNESNE, Uniform Manifold Approximation and Projection (UMAP) is a dimensional reduction technique that prioritizes local relationships to build a low-dimensional representation of the high-dimensional data that places objects that are similar in high-dimensional space close together in the . UMAP aims to preserve the essential high-dimensional structure and present it in a low-dimensional representation. This makes t-SNE well suited for analyzing high-dimensional data when the goal is to identify groups of similar objects, such as cell types in single cell RNA-Seq data.
- Click the Graph-based clusters node
- Click Exploratory analysis in the task menu
- Click t-SNE
If you have multiple samples, you can choose to run t-SNE for each sample individually or for all samples together using the Split cells by sample option. Please note that this option will not be present if you are running t-SNE on a clustering result. For clarity, clustering results run with all samples together must be viewed together and clustering results run by sample must be viewed by sample.
Like Graph-based clustering, t-SNE takes PC values as its input and further reduces the data down to two or three dimensions. For consistency, you should use the same number of PCs as the input for t-SNE that you used for Graph-based clustering.
...
| Numbered figure captions | ||||
|---|---|---|---|---|
| ||||
|

A new t-SNE task node will be produced.
...
UMAP is particularly useful for visually identifying groups of similar samples or cells in large high-dimensional data sets.
To run UMAP (Figure 15):
- Click the SVD data node
- Click the Exploratory analysis section of the toolbox
- Click UMAP
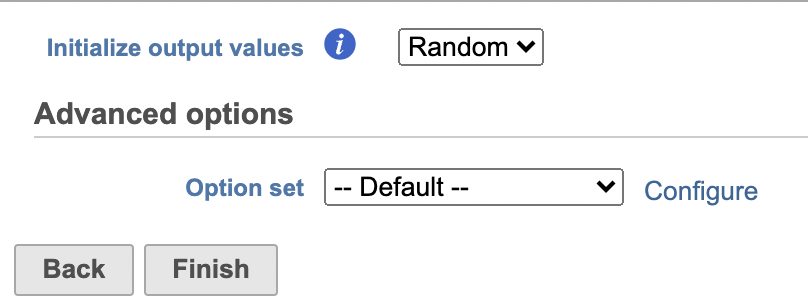
- Click Finish to run with default settings
UMAP produces a UMAP task node. Opening the task report launches a scatter plot showing the UMAP results. Each point on the plot is a cell for single cell data. The plot will open in 2D or 3D depending on the user preference.
| Numbered figure captions | ||||
|---|---|---|---|---|
| ||||
|

The t-SNE scatter plot is interactive and can be viewed for 2D or 3D (calculated separately). The t-SNE plot is 3D by default. You can rotate the 3D plot by left-clicking and dragging your mouse or using Control under Configure. You can zoom in and out using your mouse wheel. You can pan by right-clicking and dragging your mouse. You can use Style to modify color, shape, size, and labeling (e.g. add a fog effect to improve depth perception on the plot). Add a 2D plot clicking New plot, selecting 2D Scatter plot and selecting t-SNE as the source of the data.
Coloring the t-SNE scatter plot
Click on the plot to ensure that the plot window is selected. Click Style under Configure to color the t-SNE.
...
| |
|
Promoter sum matrix
The Annotate regions task in Flow labels individual peaks as promoters for a particular gene if the peak falls 1000 bases upstream from a gene's transcription start site, or 100 bases downstream from a gene's transcription start site by default (Figure 9). A promoter sum for a given gene is the number of cut sites per cell that fall within all the peaks labeled as promoters (-1000bp ~ 100bp by default or user defined through Annotate regions) for that gene. Higher promoter sum values indicate higher chromatin accessibility in the promoter region [4].
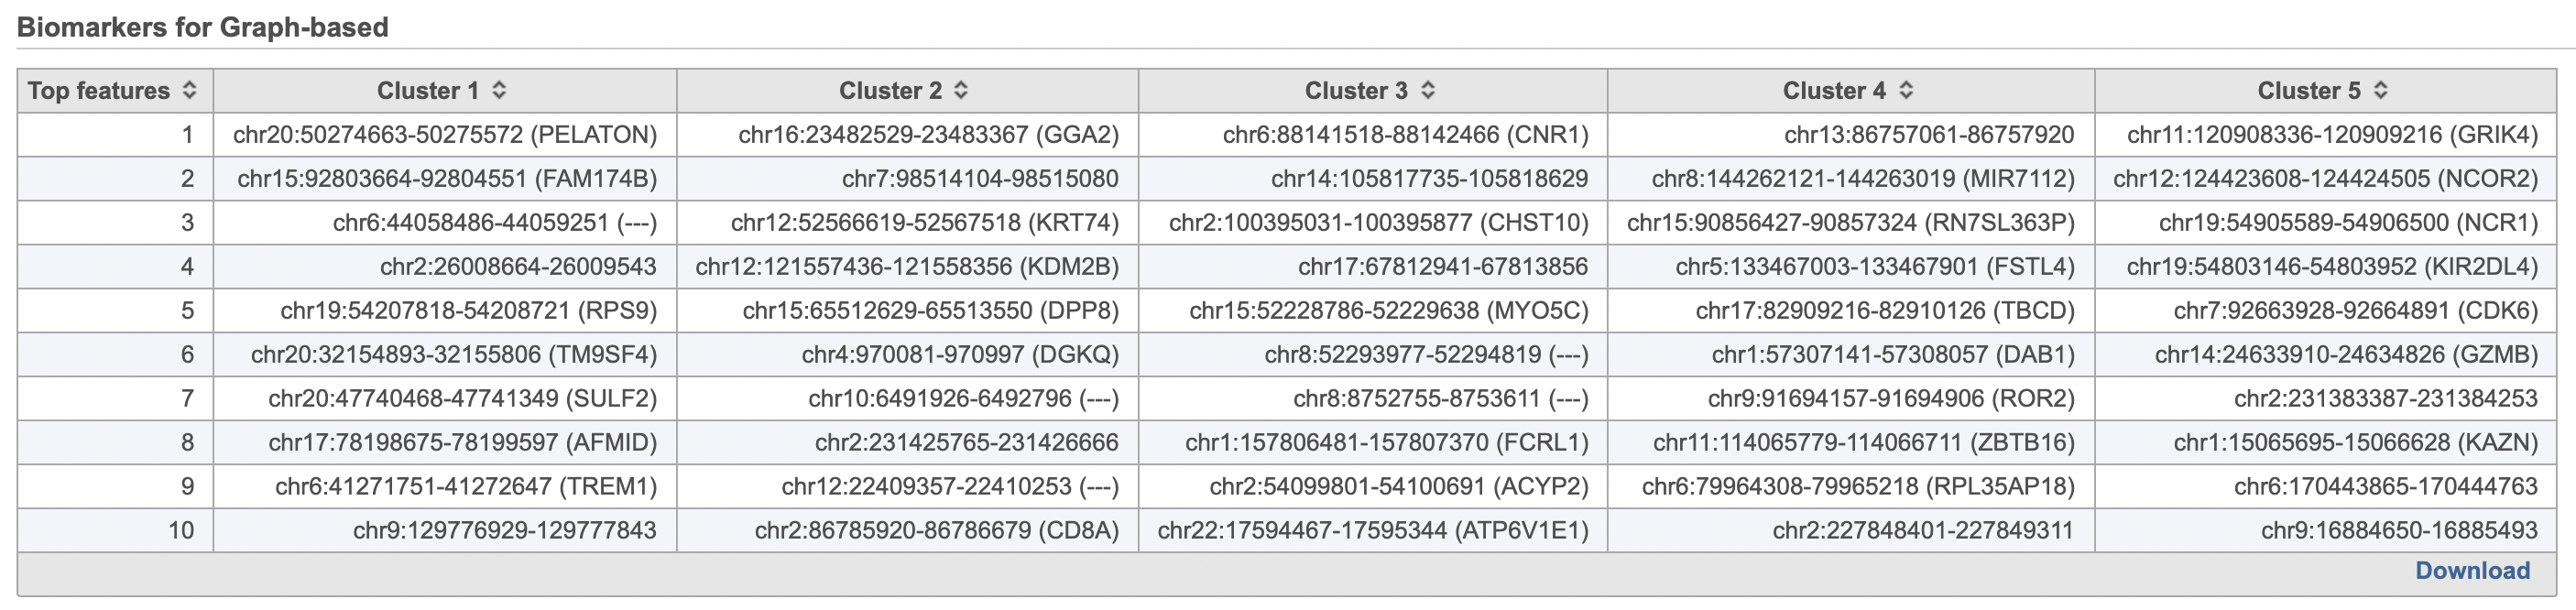
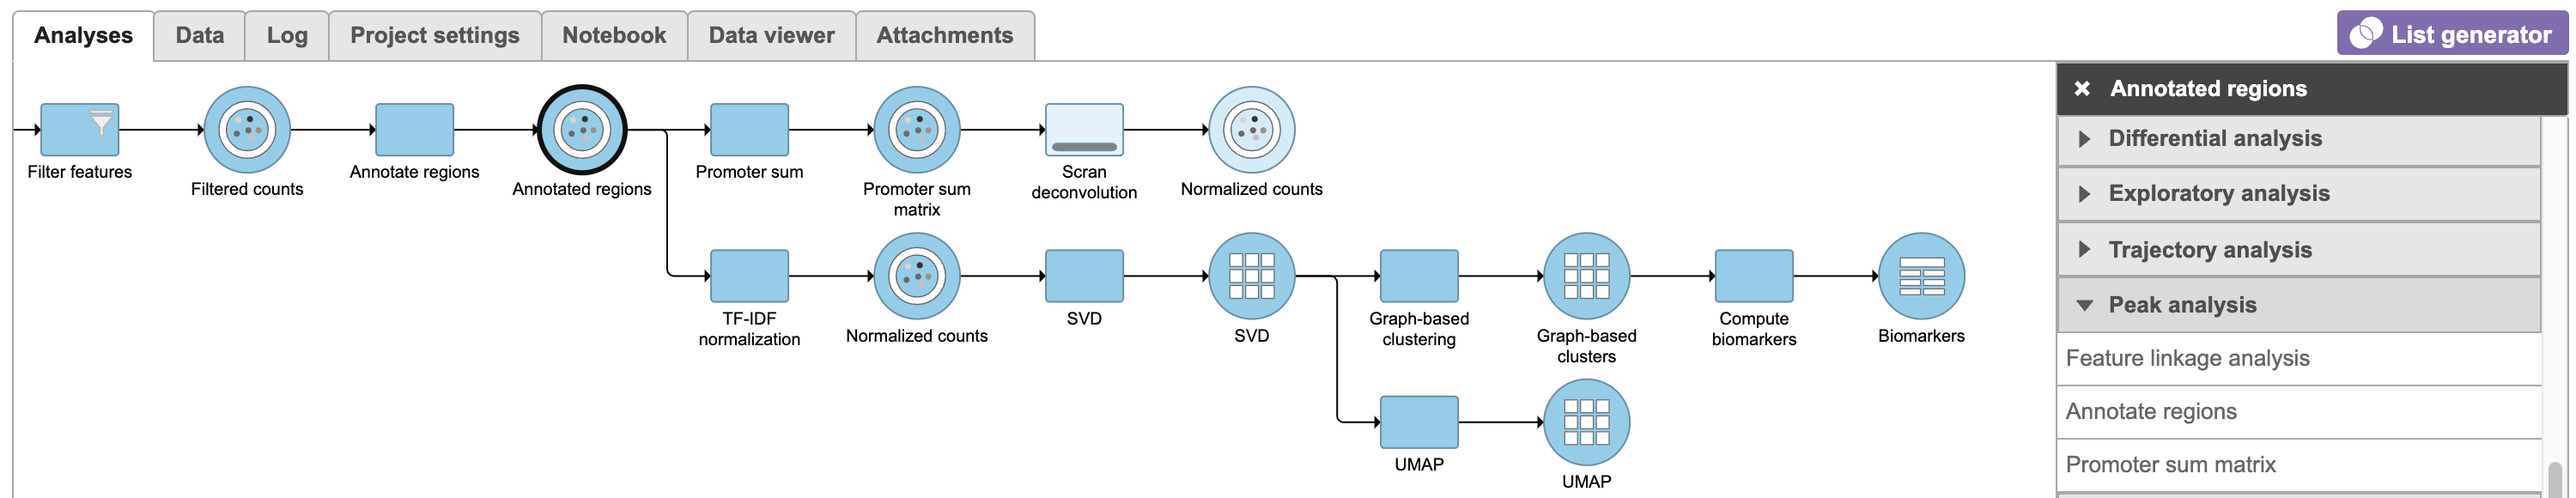
Flow task Promoter sum matrix summarizes each promoter sum and outputs a cell x gene matrix. In the matrix, only genes that have peaks within its promoter region have been included. In Flow Promoter sum matrix can be invoked in the Peak analysis section by clicking the Annotated regions data node (Figure 16).
To run Promoter sum matrix in Flow,
- Click the Annotated regions data node
- Click the Peak analysis section in the toolbox
- Click Promoter sum matrix
Once the task has been finished, a new data node will be produced where the promoter sum value for each feature can be used to color UMAP/t-SNE and to determine cell type with raw data. We recommend users normalize its output prior to color the UMAP just like the scRNA-seq data.
| Numbered figure captions | ||||||
|---|---|---|---|---|---|---|
|
| |||||
|

The cells on the plot will be colored based on their expression level of CD79A (Figure 16). In the example in Figure 16, the Style icon has been dragged to a different location on the screen and the legend has also been resized and moved. Resizing the legend can either be done on the legend itself or using the Description icon under Configure.
...
Overview
Content Tools