Page History
...
| Numbered figure captions | ||||
|---|---|---|---|---|
| ||||
|
Filter features
A common task in bulk and single-cell RNA-Seq analysis is to filter the data to include only informative genes (features). Because there is no gold standard for what makes a gene informative or not and ideal gene filtering criteria depend on your experimental design and research question, Partek Flow has a wide variety of flexible filtering options. The Filter features step can also be performed before normalization.
- Click the Normalized counts data node produced by the Normalization task
- Click Filtering in the task menu
- Click Filter features
There are four categories of filter available - noise reduction, statistics based, feature metadata, and feature list.
The noise reduction filter allows you to exclude genes considered background noise based on a variety of criteria. The statistics based filter is useful for focusing on a certain number or percentile of genes based on a variety of metrics, such as variance. The feature list filter allows you to filter your data set to include or exclude particular genes.
For example, you can use a noise reduction filter to exclude genes that are not expressed by any cell in the data set, but were included in the matrix file.
...
| Numbered figure captions | ||||
|---|---|---|---|---|
| ||||
 |
This results node, Filtered counts, will be the starting point for the next stage of analysis.
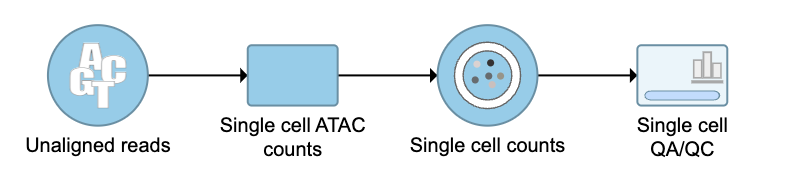
QA/QC
An important step in analyzing single cell ATAC data is to filter out low quality cells. A few examples of low-quality cells are doublets, cells with a low TSS enrichment score, cells with a high proportion of reads mapping to the genomic blacklist regions, or cells with too few reads to be analyzed. Users are able to do this in Partek Flow using the Single cell QA/QC task.
- Click on the Single cell counts node
- Click on the QA/QC section in the task menu
- Click on Single cell QA/QC
A task node, Single cell QA/QC, is produced. Initially, the node will be semi-transparent to indicate that it has been queued, but not completed. A progress bar will appear on the Single cell QA/QC task node to indicate that the task is running (Figure 5).
- Click the Single cell QA/QC node once it finishes running
- Click Task report in the task menu
| Numbered figure captions | ||||
|---|---|---|---|---|
| ||||
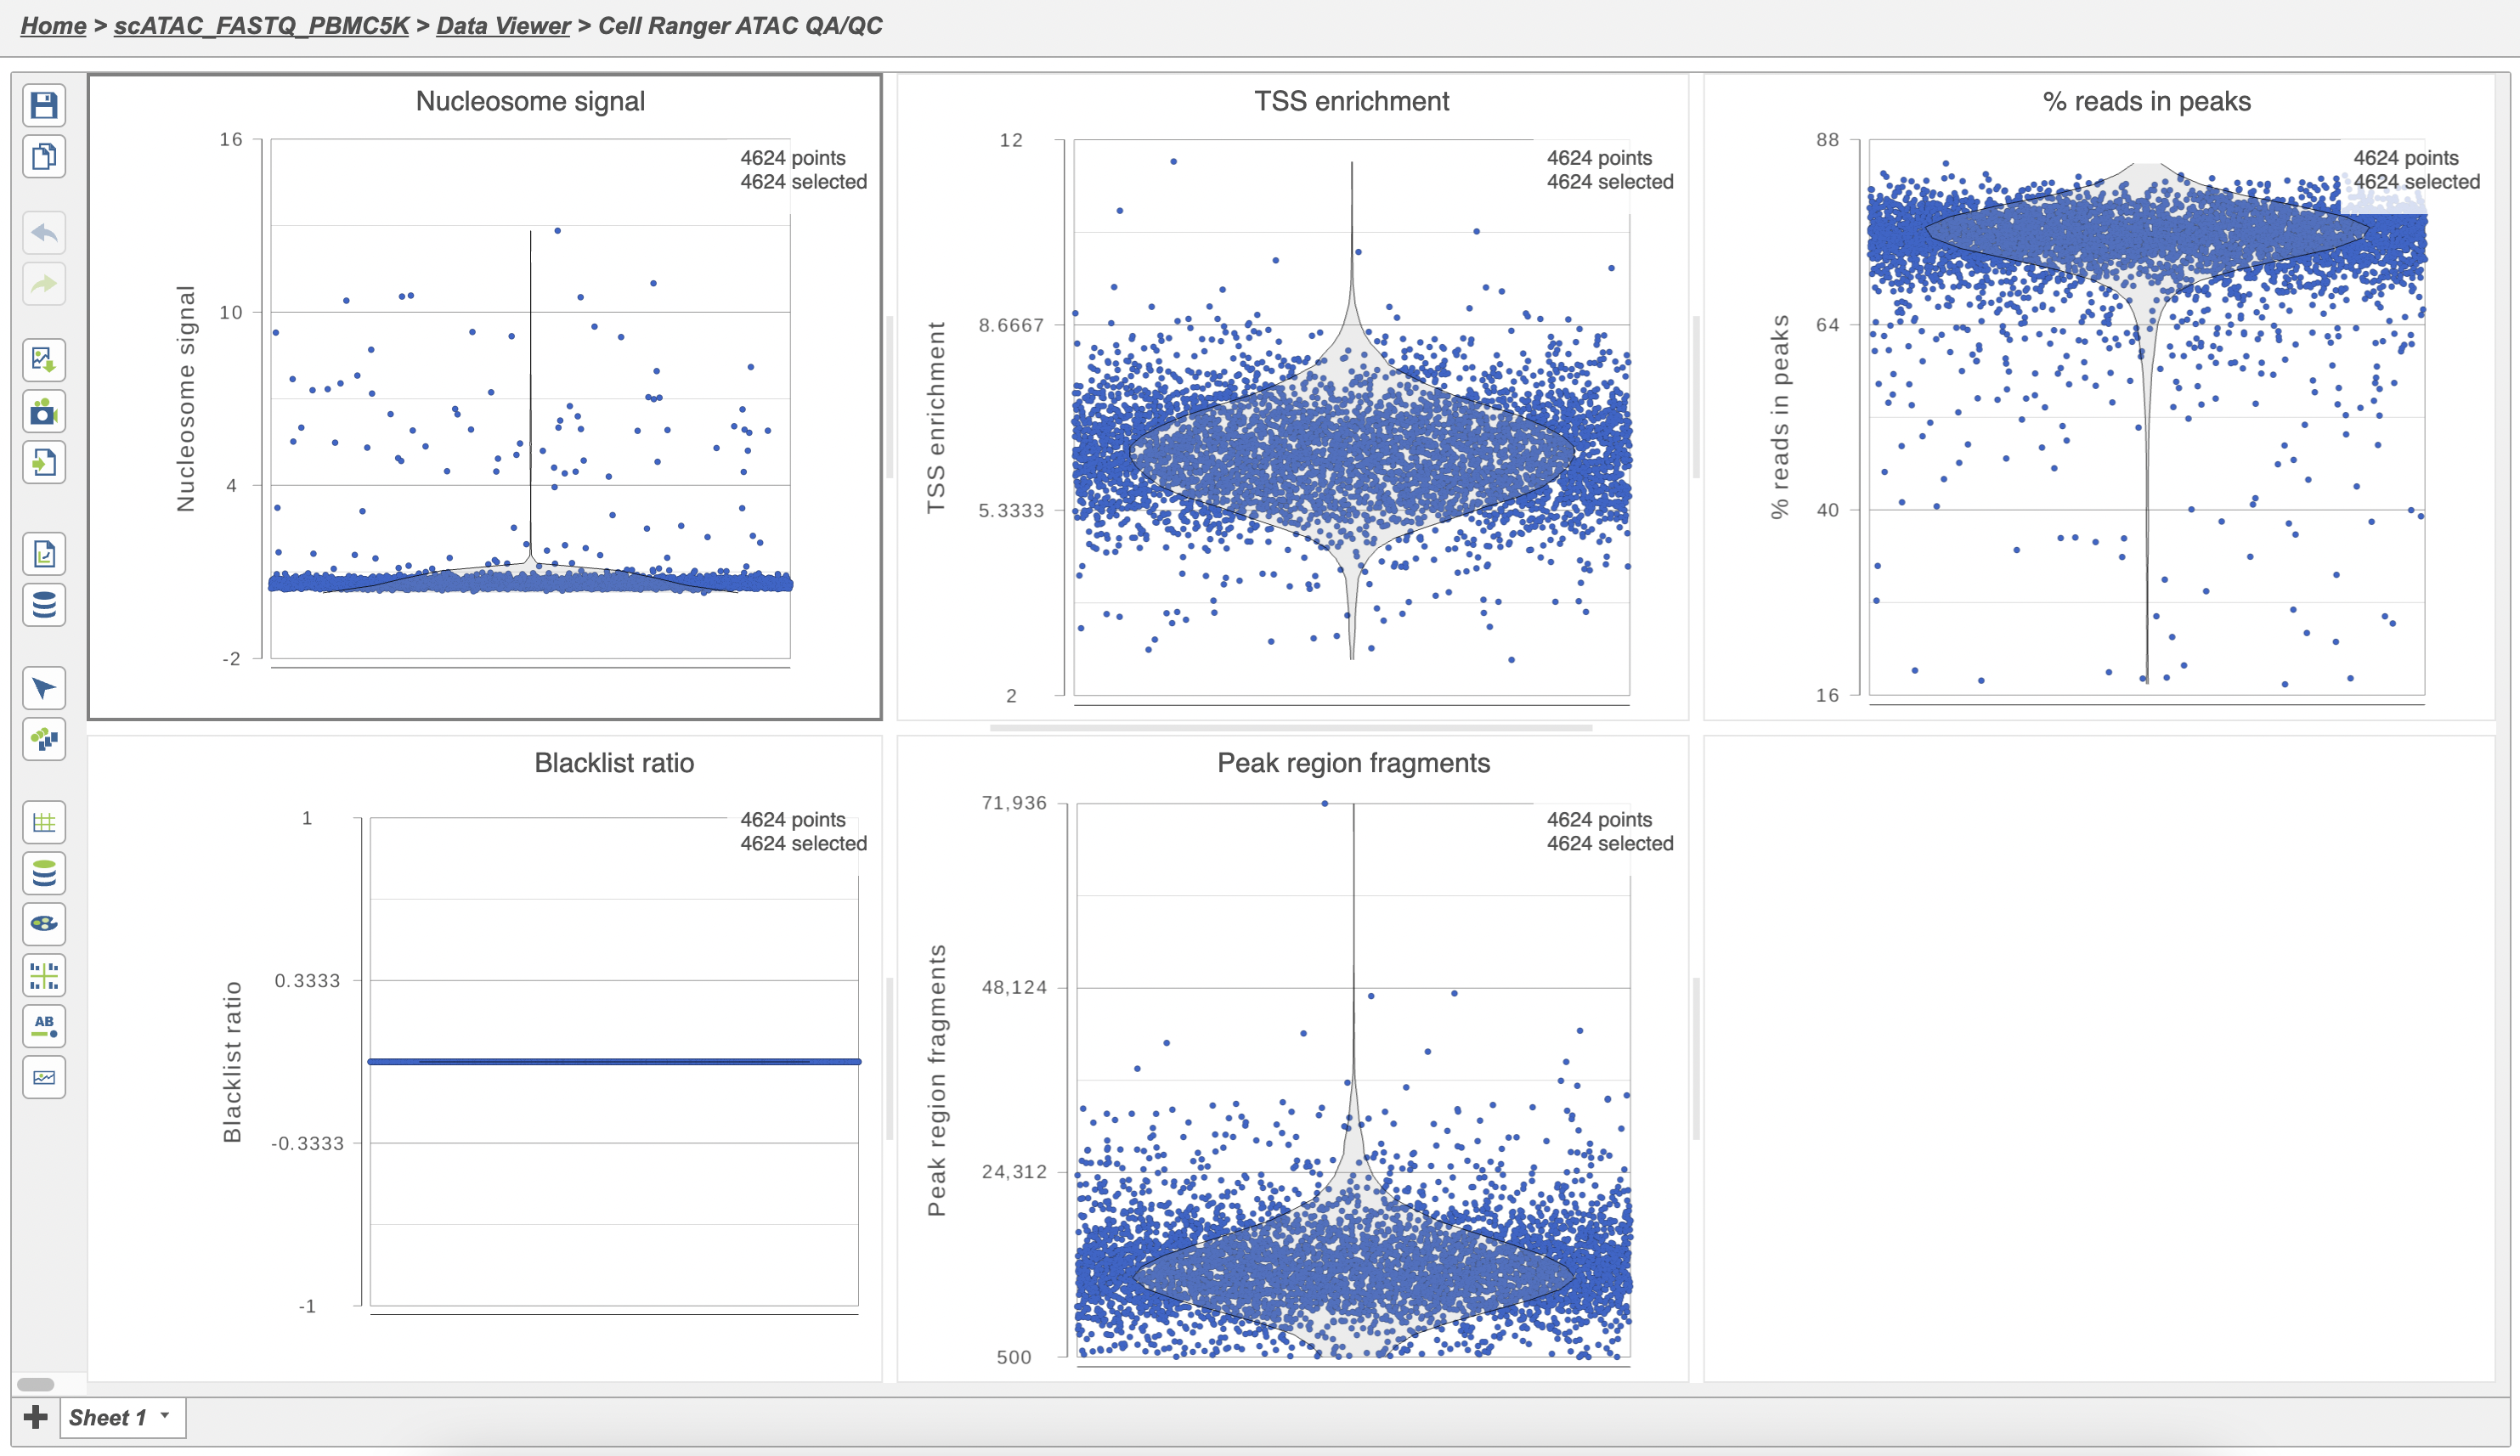 |
The Single cell QA/QC report includes interactive violin plots showing the value of every cell in the project on several quality measures (Figure 6).
There are five plots: Nucleosome signal, TSS enrichment, % reads in peaks, Blacklist ratio, and Peak region fragments. Each point on the plots is a cell and the violins illustrate the distribution of values for the y-axis metric. Cells can be filtered either by clicking and dragging to select a region on one of the plots or by setting thresholds using the filters below the plots. Here, we will apply a filter for the number of read counts. The plot will be shaded to reflect the filter. Cells that are excluded will be shown as black dots on both plots.
Descriptions of QC metrics:
Nucleosome signal: calculated per single cell, and quantify the approximate ratio of mononucleosomal to nucleosome-free fragments. Nucleosome banding pattern: The histogram of DNA fragment sizes (determined from the paired-end sequencing reads) should exhibit a strong nucleosome banding pattern corresponding to the length of DNA wrapped around a single nucleosome.
TSS enrichment: Transcriptional start site (TSS) enrichment score. The ENCODE project has defined an ATAC-seq targeting score based on the ratio of fragments centered at the TSS to fragments in TSS-flanking regions (see https://www.encodeproject.org/data-standards/terms/). Poor ATAC-seq experiments typically will have a low TSS enrichment score.
Peak region fragments: total number of fragments in peaks which is a measure of cellular sequencing depth/complexity. Cells with very few reads may need to be excluded due to low sequencing depth. Cells with extremely high levels may represent doublets, nuclei clumps, or other artifacts.
% reads in peaks: Represents the fraction of all fragments that fall within ATAC-seq peaks. Cells with low values (i.e. <15-20%) often represent low-quality cells or technical artifacts that should be removed. Note that this value can be sensitive to the set of peaks used.
Blacklist ratio: The ENCODE project has provided a list of blacklist regions, representing reads which are often associated with artifactual signals. Cells with a high proportion of reads mapping to these areas (compared to reads mapping to peaks) often represent technical artifacts and should be removed.
PCA
Principal components (PC) analysis (PCA) is an exploratory technique that is used to describe the structure of high dimensional data by reducing its dimensionality. Because PCA is used to reduce the dimensionality of the data prior to clustering as part of a standard single cell analysis workflow, it is useful to examine the results of PCA for your data set prior to clustering.
...
Overview
Content Tools