Join us for a webinar: The complexities of spatial multiomics unraveled
May 2
Page History
...
When the task is selected, the dialog will display all the categorical attributes more than one subgroups (Figure 1).
| Numbered figure captions | ||||
|---|---|---|---|---|
| ||||
|

...
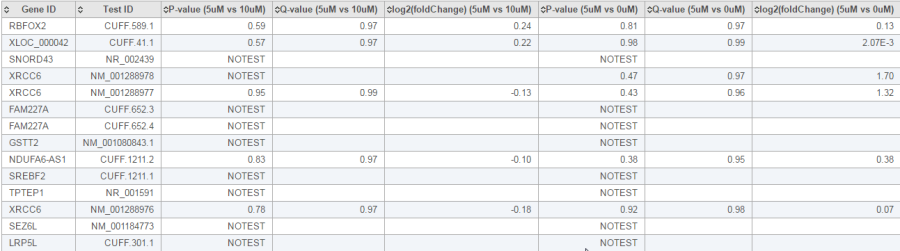
The report of the cuffdiff task is a table of a feature list p-values, q-value and log2 fold-change information for all the comparisons (Figure 20).
| Numbered figure captions | ||||
|---|---|---|---|---|
| ||||
|
...
The table can be downloaded as a text file when clicking the Download button on the lower-right corner of the table.
References
- Benjamini, Y., Hochberg, Y. (1995). Controlling the false discovery rate: a practical and powerful approach to multiple testing, JRSS, B, 57, 289-300.
- Storey JD. (2003) The positive false discovery rate: A Bayesian interpretation and the q-value. Annals of Statistics, 31: 2013-2035.
- Auer, 2011, A two-stage Poisson model for testing RNA-Seq
- Burnham, Anderson, 2010, Model selection and multimodel inference
- Law C, Voom: precision weights unlock linear model analysis tools for RNA-seq read counts. Genome Biology, 2014 15:R29.
- http://cole-trapnell-lab.github.io/cufflinks/cuffdiff/index.html#cuffdiff-output-files
- Anders S, Huber W: Differential expression analysis for sequence count data. Genome Biology, 2010
...
| Additional assistance |
|---|
| Rate Macro | ||
|---|---|---|
|
...
Overview
Content Tools