Join us for a webinar: The complexities of spatial multiomics unraveled
May 2

Partek Flow Documentation

Page tree

Versions Compared

Key

  • This line was added.
  • This line was removed.
  • Formatting was changed.

...

Numbered figure captions
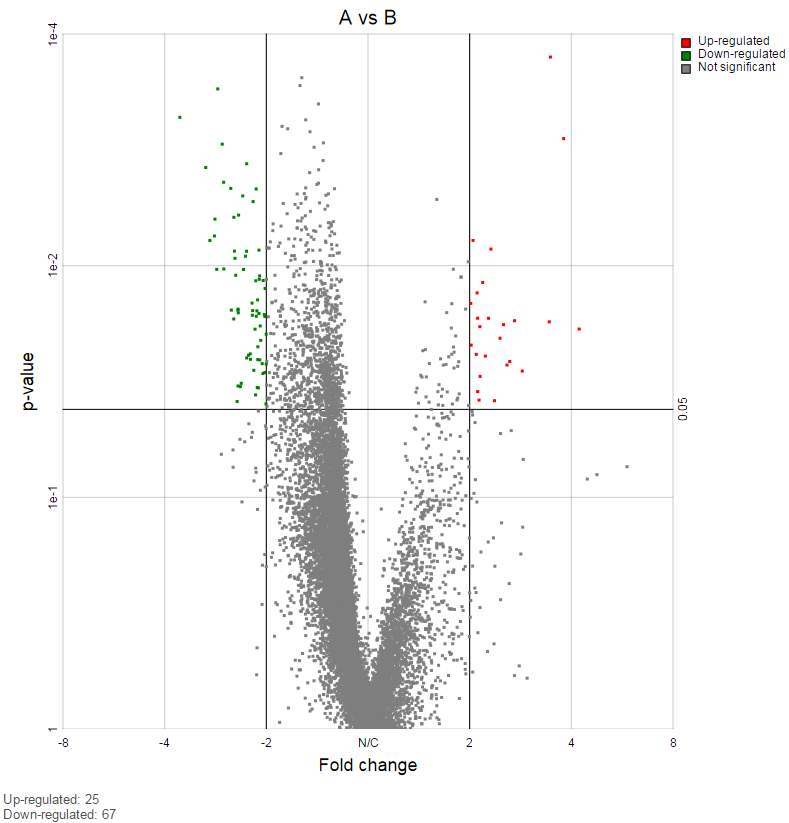
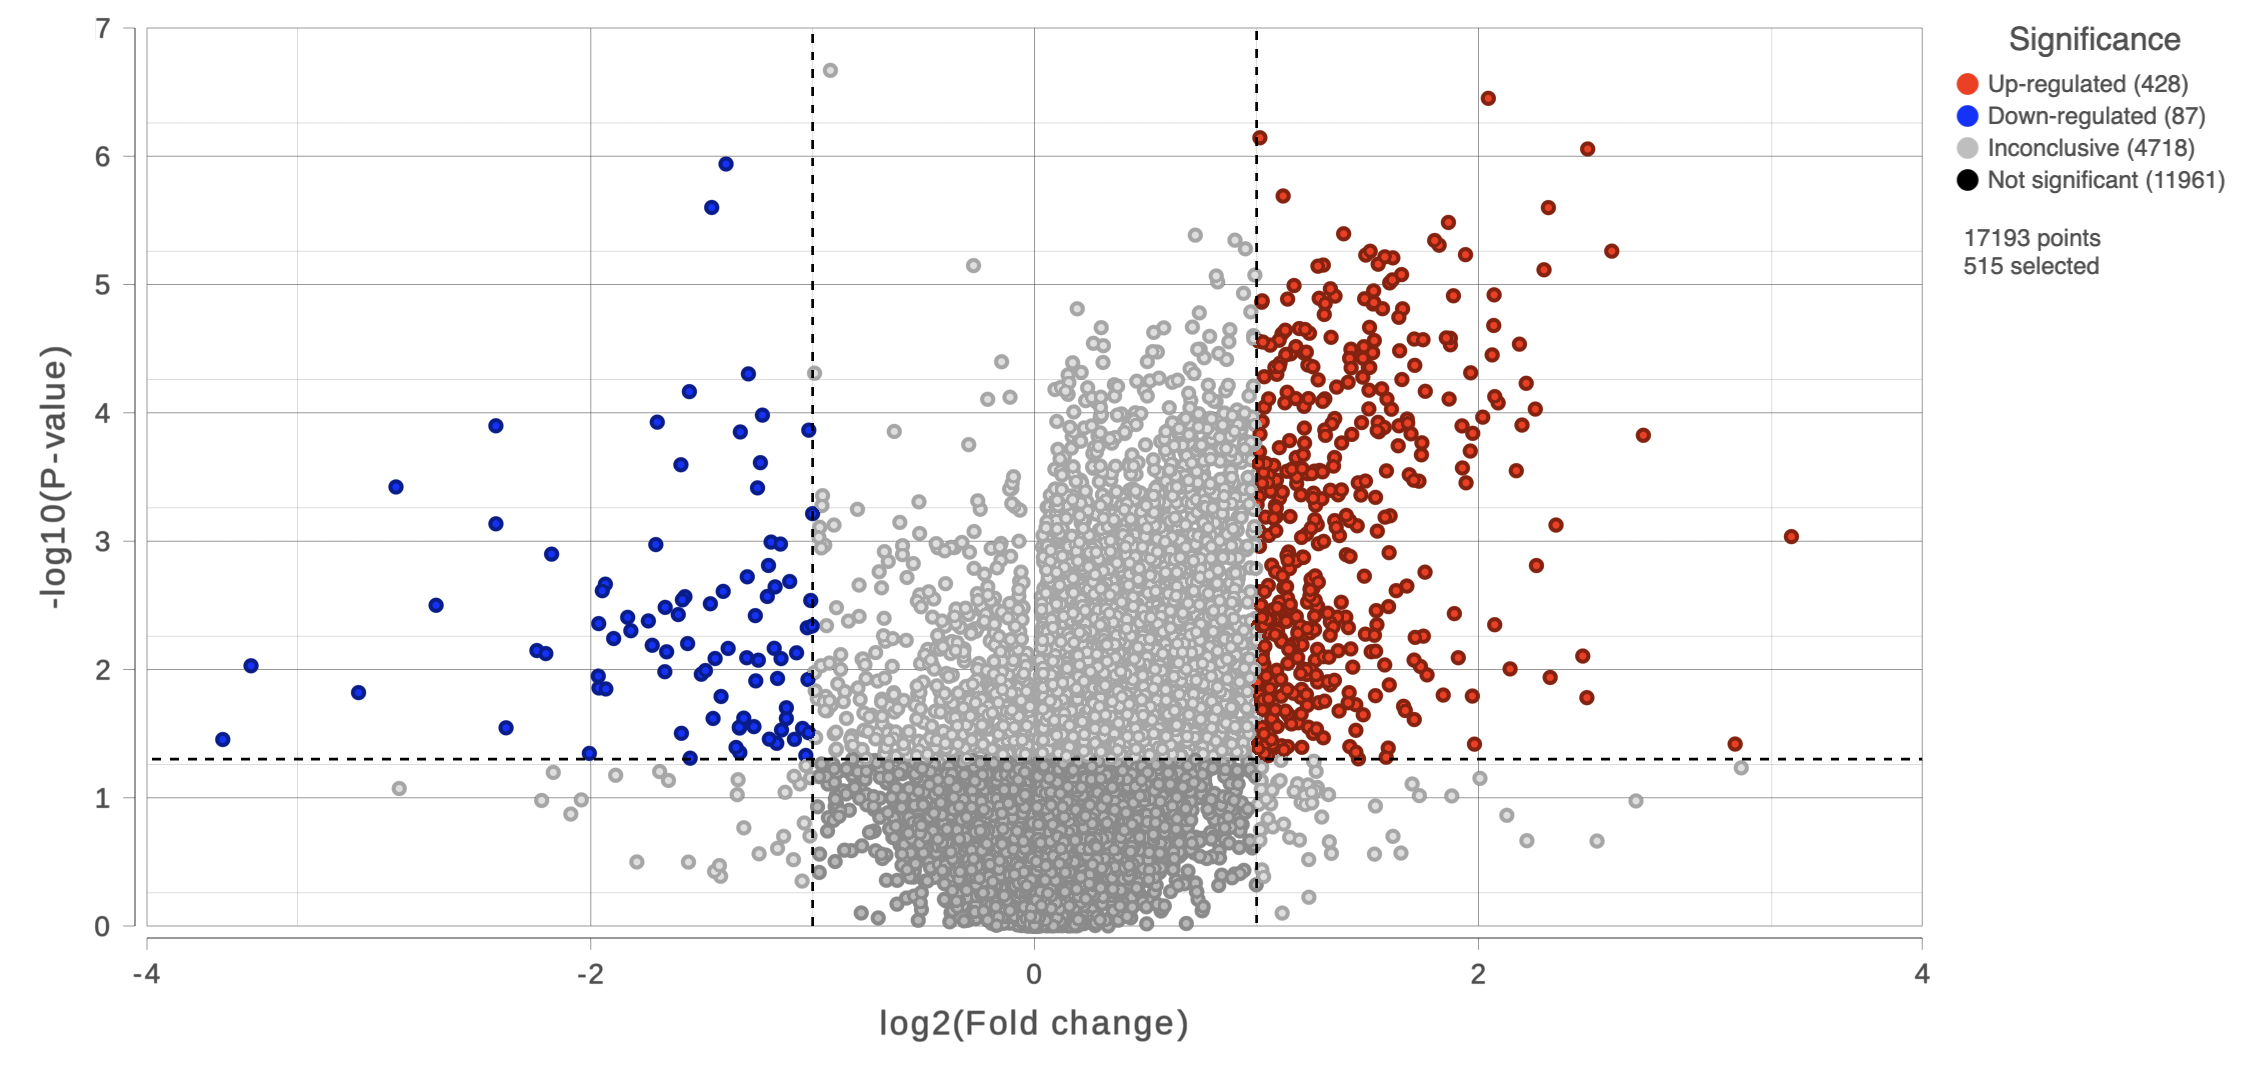
SubtitleTextVolcano plot in comparison A vs B. X-axis represents fold change (linear scale), Y-axis represents negative logged p-value (unadjusted), each dot is a feature. The horizontal line represents p-value of 0.05, two vertical lines represent fold change of -2 and 2. Lower left corner displays number of features passing the fold-change and p-value criteria
AnchorNameVolcano plot

Image RemovedImage Added

Feature list filter panel is on the left of the table (Figure 12). Click on the black triangle (  ) to collapse and expand the panel.

...


The filtered result can be saved into a filtered data node by selecting the Generate list button at the lower-left corner of the table ( Image RemovedImage Added ). Selecting the Download button at the lower-right corner of the table downloads the table as a text file to the local computer.

...