Page History
...
Invoking Find Multimodal Neighbours
This task can only be performed on data nodes containing PCA scores – which are PCA output and graph based clustering output nodes generated from PCA nodes. To start, select a PCA data node of one of the assays (e.g. gene expression) and go to Exploratory analysis > Find multimodal neighbors in the toolbox. On the task setup page, use the Select data node button to point to the PCA data node of the other assay (e.g. protein expression), by default, there is a node selected (Figure 1).
| Numbered figure captions | ||||
|---|---|---|---|---|
| ||||
|
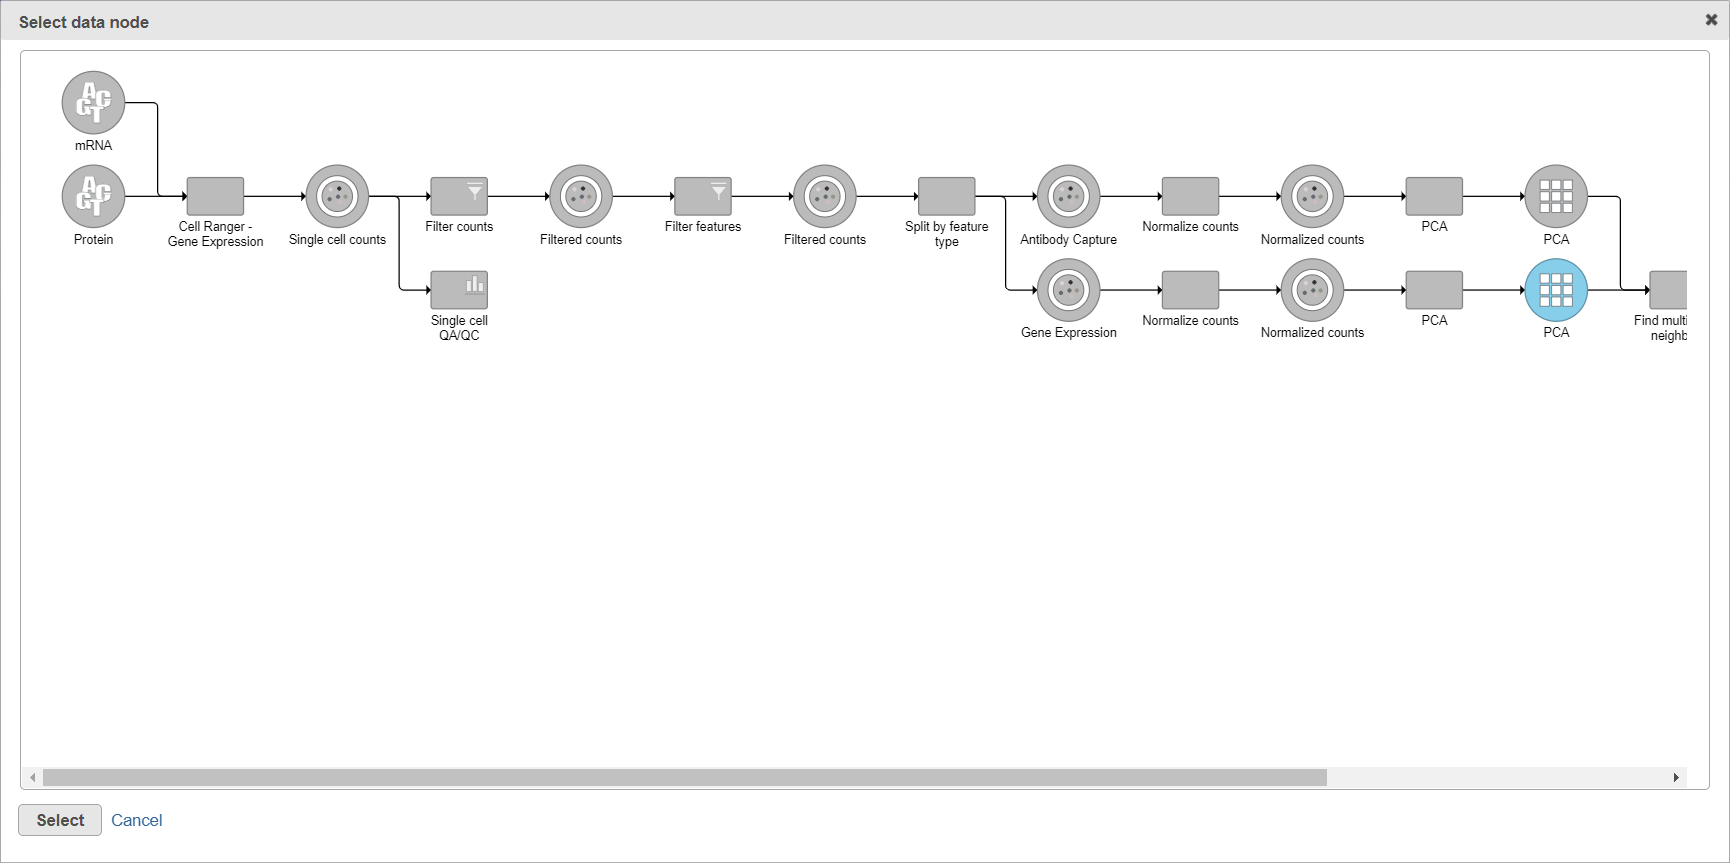
When you click the Select data node button, Partek Flow will open another dialog, showing your current pipeline (Figure 2). Data nodes that can be used for WNN are in bluecolor of the branch, other nodes are disabled (greyed out). To pick a node, left-click on it and then push the Select button.
...
| Numbered figure captions | ||||
|---|---|---|---|---|
| ||||
|
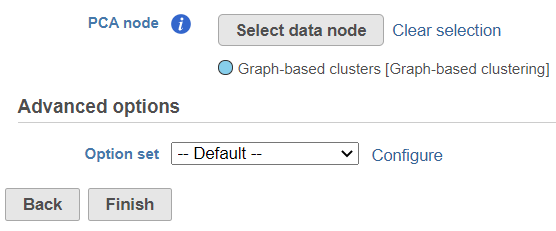
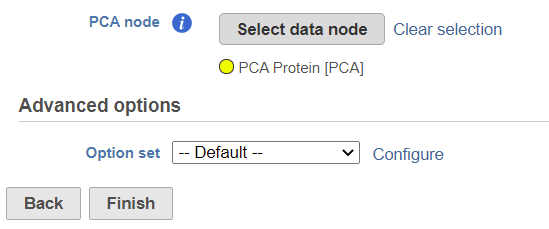
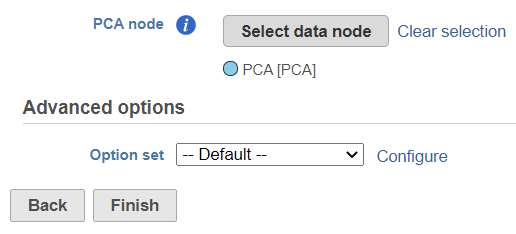
The selected data node is shown under the Select data node button. If you made a mistake, use the Clear selection link (Figure 31).
| Numbered figure captions | ||||
|---|---|---|---|---|
| ||||
|
If there are graph-based clustering task performed on PCA data node, the output of graph-based clustering node also has PCA score from the input data, so the output graph-based clustering data nodes also can be candidate of WNN task.
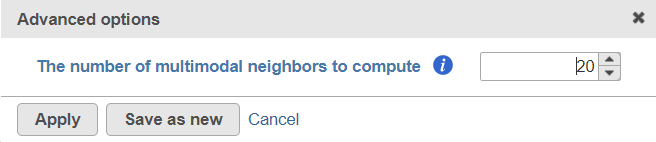
To customize the Advanced options, select the Configure link (Figure 31). At present you can only change the number of nearest neighbors for each modality (-k.nn option of the Seurat package); the default value is 20 (Figure 43). An illustration on how to use that option to assess the robustness of WNN analysis can be found in Hao et al. (1). The nearest neighbor search method is K-NN and distance metric is Euclidean.
| Numbered figure captions | ||||
|---|---|---|---|---|
| ||||
|
To launch the Find multimodal neighbors task, click the Finish button on the task setup page (Figure 31). For each cell, the WNN algorithm calculates its closest neighbors based on a weighted combination of RNA and protein similarities. The output of the Find multimodal neighbors task is a WNN data node.
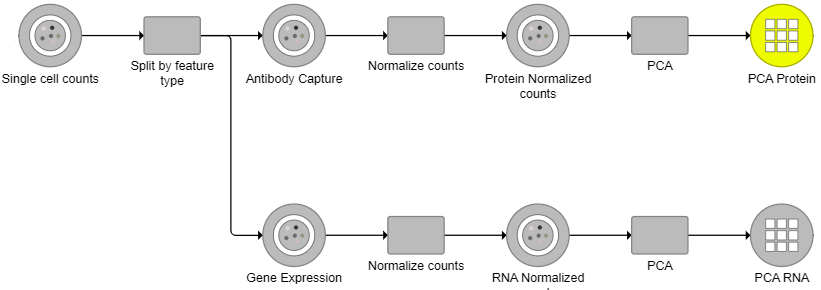
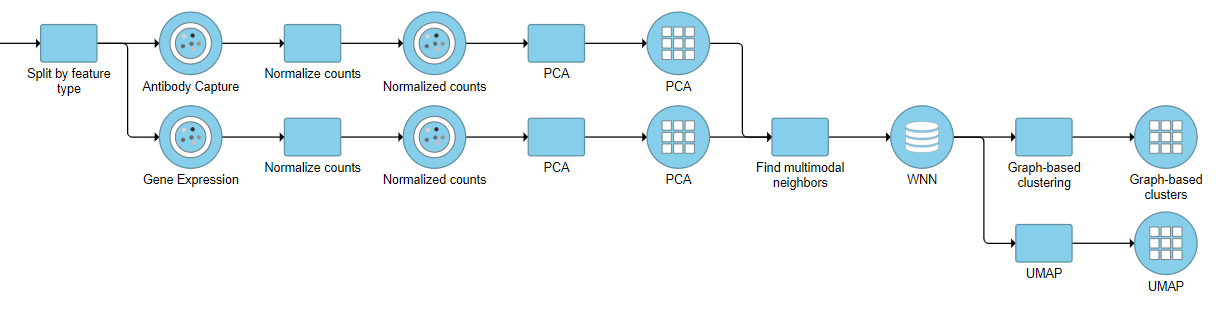
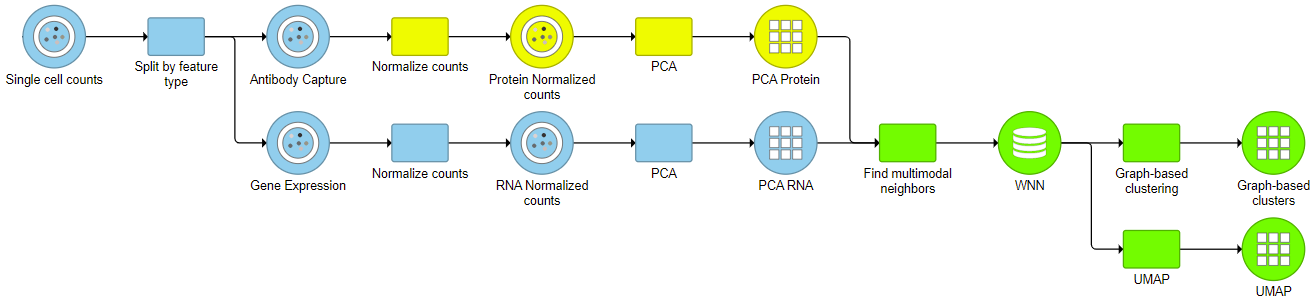
For downstream analysis, you can launch a UMAP or graph-based clustering tasks on a WNN node. For example, Figure 5 4 shows a snippet of analysis of a feature barcoding data set; gene expression and protein expression data were processed separately, and then Find multimodal neighbors was invoked on two respective PCA data nodes. UMAP and graph-based clustering tasks were performed on WNN node.
| Numbered figure captions | ||||
|---|---|---|---|---|
| ||||
|
For an excellent illustration on advantages of WNN algorithm for identification of cell types, please see this blog post.
...
- Hao Y, Hao S, Andersen-Nissen E, et al. Integrated analysis of multimodal single-cell data. Cell. 2021;184(13):3573-3587.e29. doi:10.1016/j.cell.2021.04.048
- https://satijalab.org/seurat/articles/weighted_nearest_neighbor_analysis.html
Overview
Content Tools