Page History
...
| Numbered figure captions | ||||
|---|---|---|---|---|
| ||||
|
...
| Numbered figure captions | ||||
|---|---|---|---|---|
| ||||
|
The following normalization methods will generate different results depending on whether the transformation was performed on samples or on features:
...
| Numbered figure captions | ||||
|---|---|---|---|---|
| ||||
|

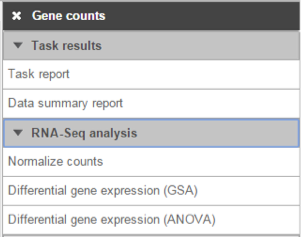
Normalization Methods
...
- Normalize the reads by the length of feature, it generate reads per kilobase
RPKsf = Xsf / Lf; - Sum up all the RPKsf in a sample
PRKs = ∑Ff=1 FRPKsf - Generate a scaling factor for each sample by normalizing the PRK of the sample to the sum PRK of all the samples
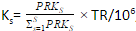
,
where TR is the total reads across all samples - Divide raw reads by the scaling factor to get TPM
TXsf = Xsf/Ks
- Normalize the reads by the length of feature, it generate reads per kilobase
...
| Numbered figure captions | ||||
|---|---|---|---|---|
| ||||
|
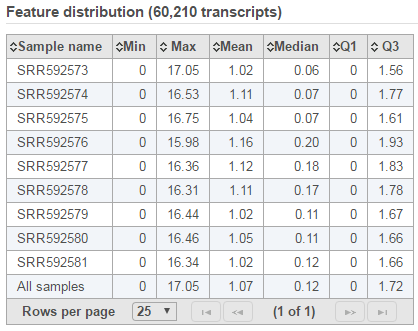
Expression signal
...
| Numbered figure captions | ||||
|---|---|---|---|---|
| ||||
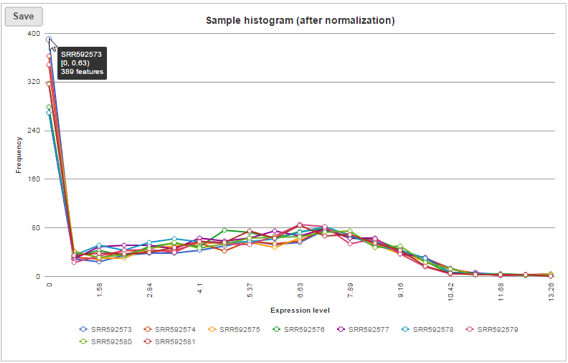
Sample histogram
...
| Numbered figure captions | ||||
|---|---|---|---|---|
| ||||
|
References
Bolstad BM, Irizarry RA, Astrand M, Speed, TP. A Comparison of Normalization Methods for High Density Oligonucleotide Array Data Based on Bias and Variance. Bioinformatics. 2003; 19(2): 185-193.
Mortazavi A, Williams BA, McCue K, Schaeffer L, Wold B. Mapping and quantifying mammalian transcriptomes by RNA-Seq. Nat Methods. 2008; 5(7): 621–628.
- Bullard JH, Purdom E, Hansen KD, Dudoit S. Evaluation of statistical methods for normalization and differential expression in mRNA-Seq experiments. BMC Bioinformatics. 2010; 11: 94.
- Robinson MD, Oshlack A. A scaling normalization method for differential expression analysis of RNA-seq data. Genome Biol. 2010; 11: R25.
- Dillies MA, Rau A, Aubert J et al. A comprehensive evaluation of normalization methods for Illumina high-throughput RNA sequencing data analysis. Brief Bioinform. 2013; 14(6): 671-83.
- Wagner GP, Kin K, Lynch VJ. Measurement of mRNA abundance using RNA-seq data. Theory Biosci. 2012; 131(4): 281-5.
- Ritchie ME, Phipson B, Wu D et al. Limma powers differential expression analyses for RNA-sequencing and microarray studies. Nucleic Acids Res. 2015; 43(15):e97.
...
Overview
Content Tools