Page History
...
| Numbered figure captions | ||||
|---|---|---|---|---|
| ||||
|
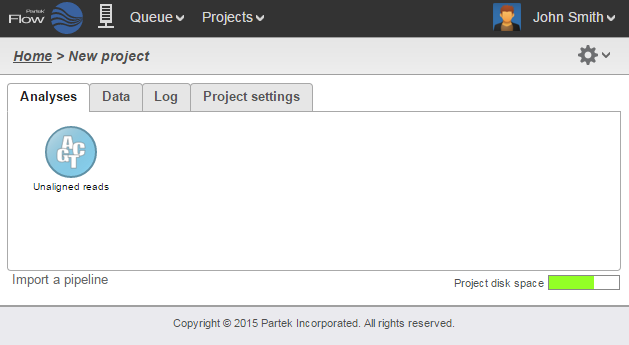
Data and Task
...
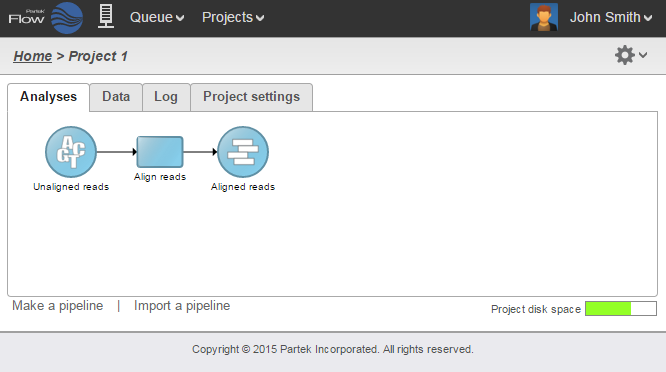
Nodes
The Analyses tab contains two elements: data nodes (circles) and task nodes (rounded rectangles) connected by lines and arrows. Collectively, they represent a data analysis pipeline.
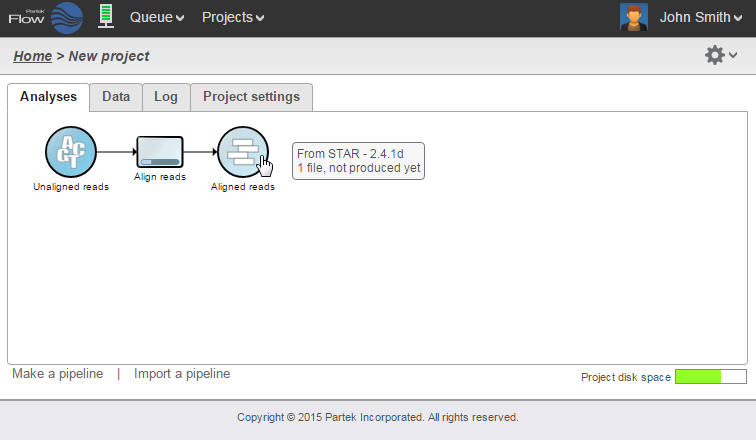
Data nodes (Figure 2) may represent a file imported into the project, or a file generated by Partek Flow as an output of a task (e.g., alignment of FASTQ files generates BAM files).
...
| Numbered figure captions | ||||
|---|---|---|---|---|
| ||||
|
The
...
Context Sensitive Menu
Clicking on a node reveals the context sensitive menu, on the right side of the screen.
...
| Numbered figure captions | ||||
|---|---|---|---|---|
| ||||
|
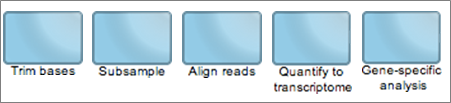
Running a
...
Task
To run a task, select a data node and then locate the task you wish to perform from the context sensitive menu. Mouse over to see a description of the action to be performed. Click the specific task, set the additional parameters (Figure 6), and click Finish. The task will be scheduled, the display will refresh, and the screen will return to the project's Analyses tab.
...
| Numbered figure captions | ||||
|---|---|---|---|---|
| ||||
|
Canceling and
...
Deleting Tasks
Tasks can only be cancelled or deleted by the user that started the task or by the owner of the project. Running or pending tasks can be canceled by clicking the right mouse button on the task node and then selecting Cancel (Figure 8). Alternatively, the task node may be selected and the Cancel task selected from the context sensitive menu.
...
To select a different layer, use the left mouse button to click on any node of the desired layer. All the nodes associated with the selected layer have the same color and when clicked will be displayed on the top of the stack.
Collapsing Tasks
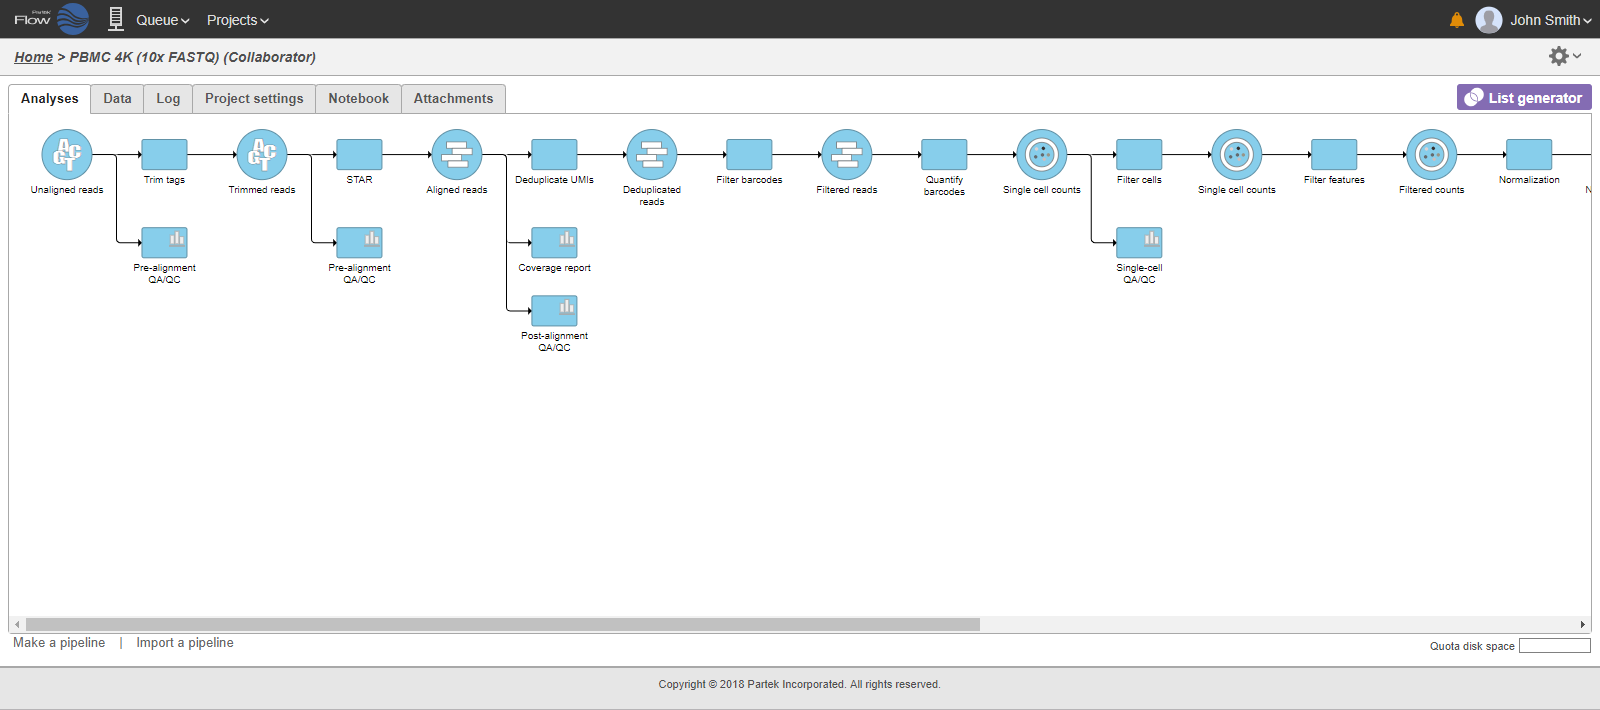
Addition of of task and respective resulting data nodes to project may lead to creation of long pipelines, extending well beyond the border of the canvas (Figure 18).
| Numbered figure captions | ||||
|---|---|---|---|---|
| ||||
|
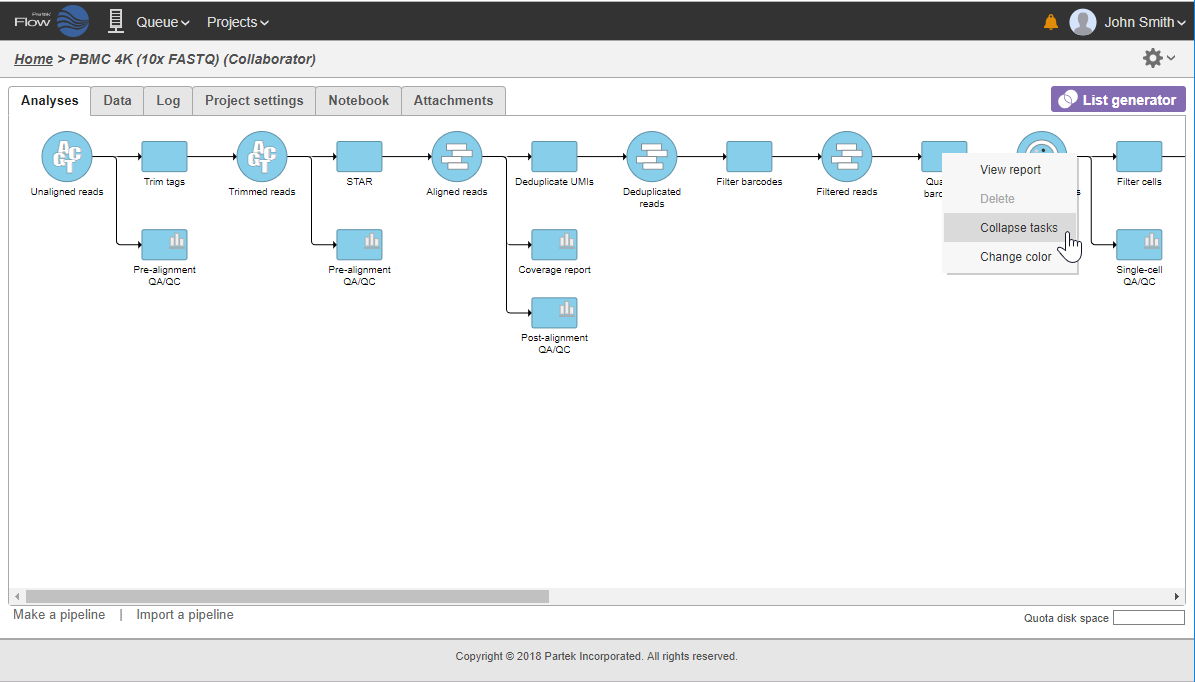
In that case, the pipeline can be collapsed, to hide the steps that are (no longer) relevant. For example, once the single-cell RNA-seq data has been quantified, Single cell counts data node will be a new analysis start point, as the subsequent analyses will not focus on alignment, UMI deduplication etc. To start, right-click on the task node which should become a boundary (=end) of the collapsed portion of your pipeline and select Collapse tasks (Figure 19).
| Numbered figure captions | ||||
|---|---|---|---|---|
| ||||
|
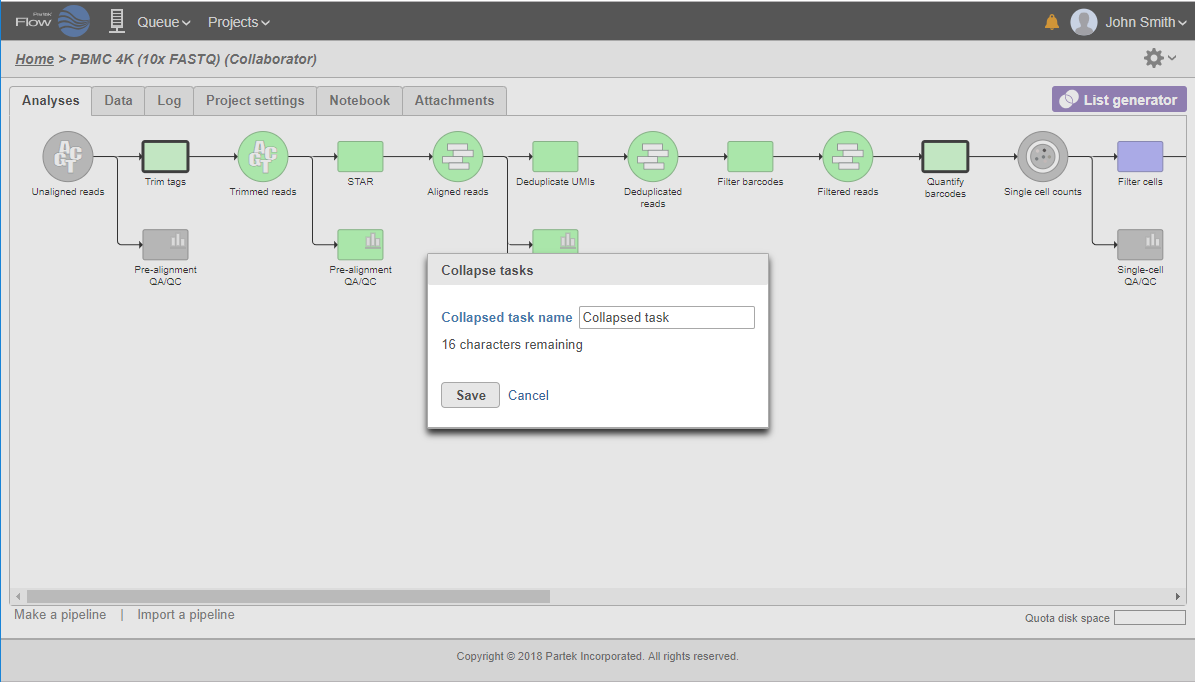
All the tasks on that layer will turn purple. Then left-click the task which should be the other boundary of the collapsed portion. The All the tasks that will be collapsed will turn green and a dialog will appear (Figure 19). In the example shown in Figure 19, the tasks between Trim tags and Quantify barcodes will be collapsed. Give the collapsed section a name (up to 30 characters) and select Save Save (Figure 20).
| Numbered figure captions | ||||
|---|---|---|---|---|
| ||||
|
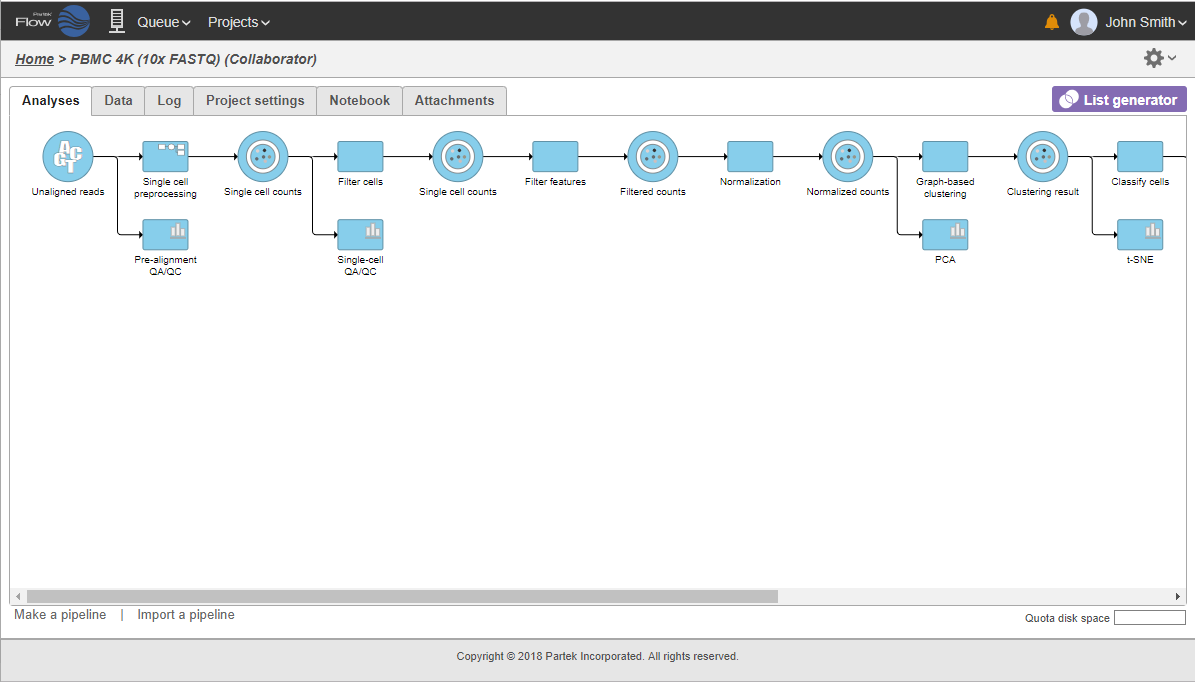
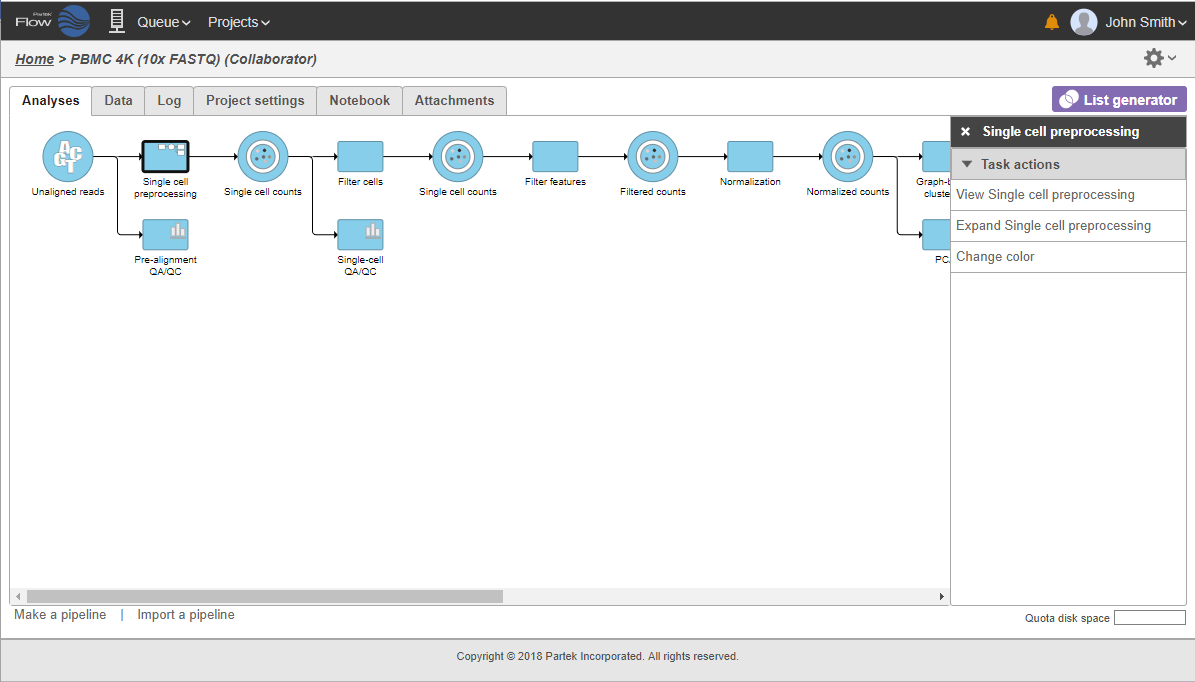
The collapsed portion of the pipeline is replaced by single task node, with a custom label ("Single cell preprocessing"; Figure 21).
| Numbered figure captions | ||||
|---|---|---|---|---|
| ||||
|
To re-expand the pipeline double click on the task node representing the collapsed portion of the pipeline. Alternatively, single click on the node and select Expand... on the context-sensitive menu. Within the same menu, you can also preview the contents of the collapsed task by selecting View... (Figure 22).
| Numbered figure captions | ||||
|---|---|---|---|---|
| ||||
|
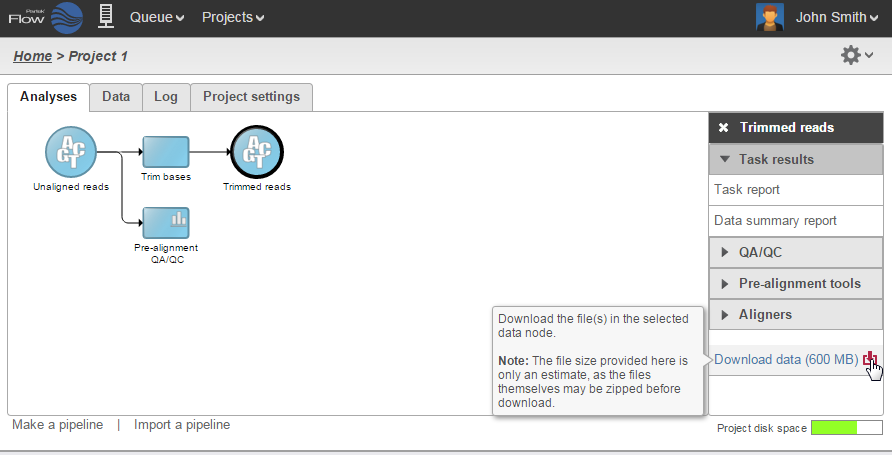
Downloading Data
Data associated with any data node can be downloaded using the Download data link in the context sensitive menu (Figure 1823). Compressed files will be downloaded to the local computer where the user is accessing the Partek Flow server. Note that bigger files (such as unaligned reads) would take longer to download. For guidance, a file size estimate is provided for each data node. These zipped files can easily be imported by the Partek® Genomics Suite® software.
| Numbered figure captions | ||||
|---|---|---|---|---|
| ||||
|
Project
...
Disk Space
The lower right corner of the Analyses tab shows the Project disk space icon. Mouse over the icon to get information about the total space and usage available for your project (Figure 1924). The icon changes color from green to red as the used space gets closer to the total space (green < 80%, yellow < 90%, red >= 90%).
...
Overview
Content Tools