Join us for a webinar: The complexities of spatial multiomics unraveled
May 2
Page History
...
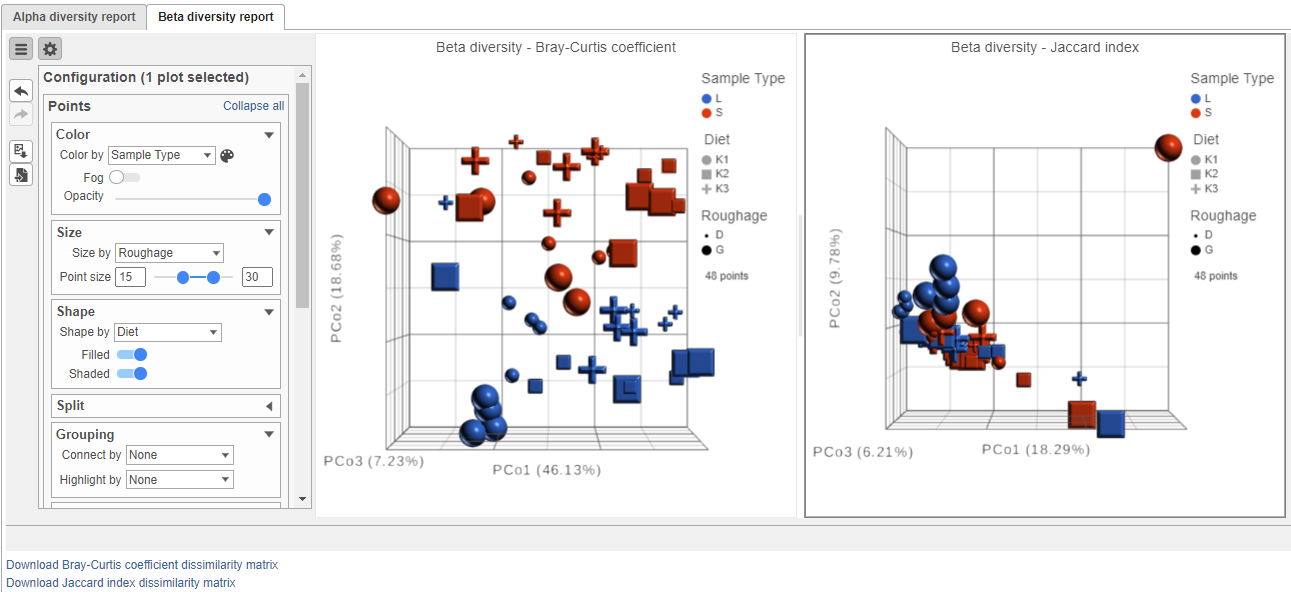
To obtain the table of pairwise comparisons (dissimilarity matrix) for each distance metric, click the appropriate hyperlink below the Data viewer. The table will be downloaded as a tab-delimited text file. For both distance metrics, the values range from 0 to 1. The higher the value, the more different that pair of samples are. The lower the value, the more similar they are.
| Numbered figure captions | ||||
|---|---|---|---|---|
| ||||
|
...
Overview
Content Tools