Join us for a webinar: The complexities of spatial multiomics unraveled
May 2
Page History
This task can be invoked from count matrix data node or clustering task report (Statistics > Compute biomarkers). It performs Student's t-tests on the selected attribute, comparing one subgroup at a time vs all the others combined. The By default, the up-regulated genes as are reported as biomarkers.
| Table of Contents | ||||||
|---|---|---|---|---|---|---|
|
...
| Numbered figure captions | ||||
|---|---|---|---|---|
| ||||
|

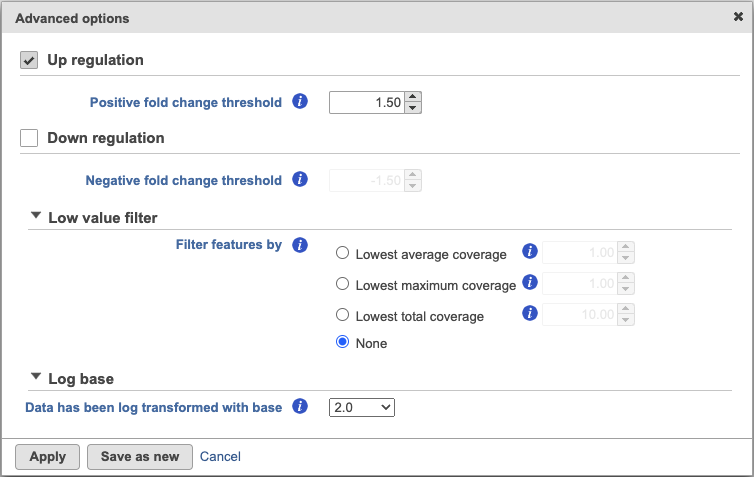
By default, the result outputs the top 10 features that are up-regulated by at least 1.5 fold change (in linear scale) for each subgroup comparing to the others. The result is displayed in a table with each column is a subgroup name, each row is a feature. Features are ranked by the ascending p-values within each sub-category. An example is shown in Figure 3. If a subgroup has fewer biomarkers than the others, the "extra" fields for that subgroup will be left blank.
...
Overview
Content Tools