Page History
...
If the alignment was generated in Partek® Flow®, the genome assembly will be displayed as text on the top of the page (Figure 1), you do not have the option to change the reference.
| Numbered figure captions | ||||
|---|---|---|---|---|
| ||||
|
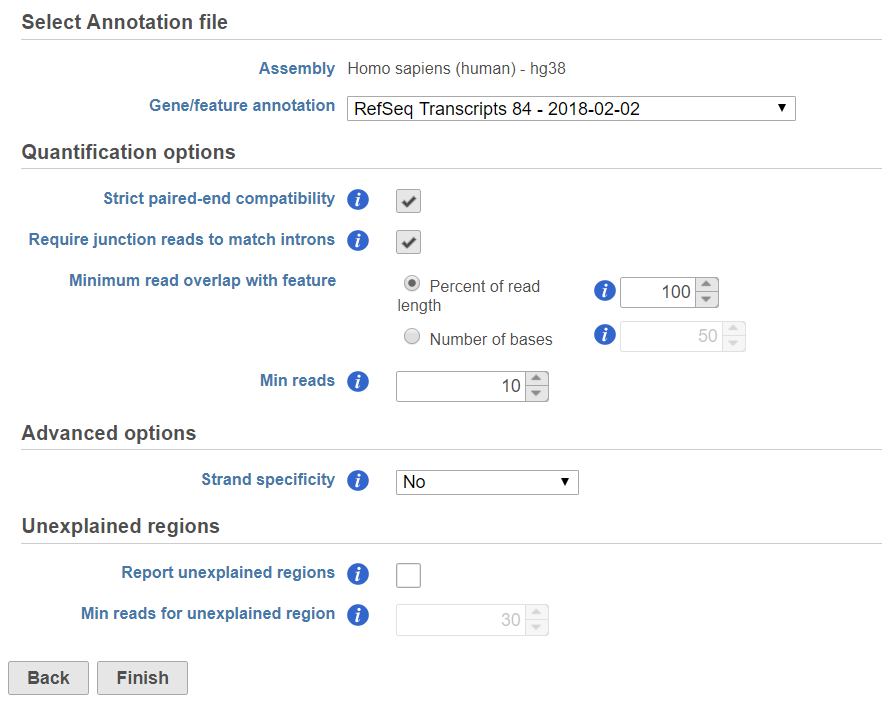
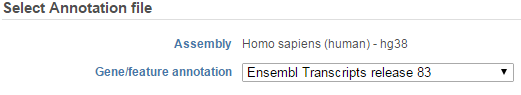
If the bam file is imported, you need to select the assembly with which the reads were aligned to, and which annotation model file you will use to quantify from the drop-down menus (Figure 2).
| Numbered figure captions | ||||
|---|---|---|---|---|
| ||||
|
...
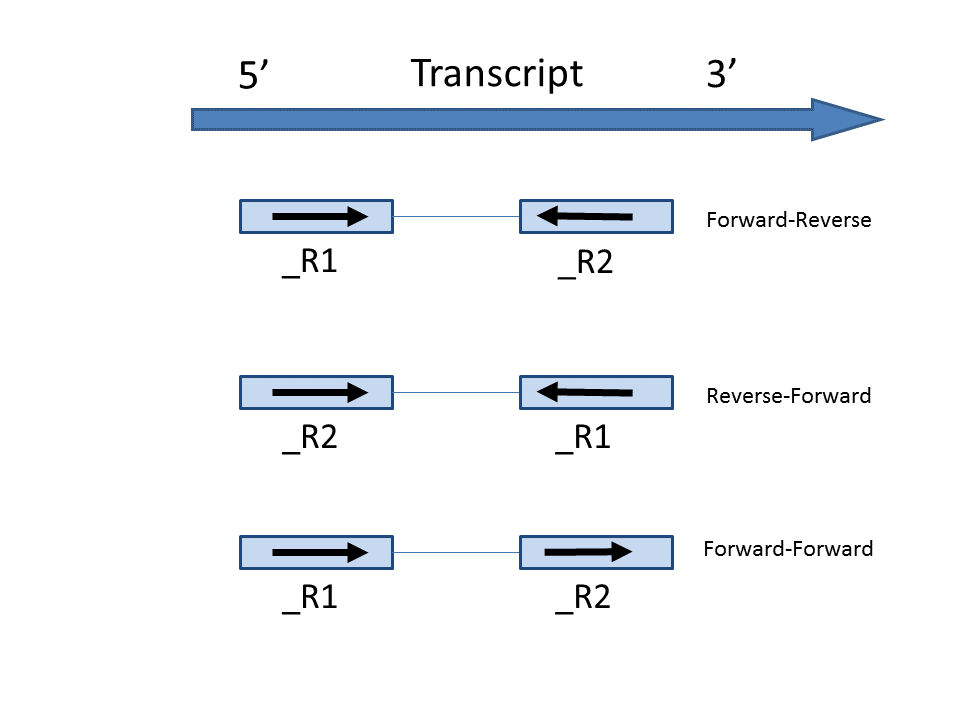
- Auto-detect: The first 200,000 reads will be used to examine the strand compatibility with the transcripts. Two The following percentages are calculated on paired-end reads:
- (1)
- If (first-in-pair
- same strand
- + second-in-pair
- same strand)/Alignments examined > 75%, Forward-Forward will be specified
- (2) If (first-in-pair
- same strand + second-in-pair
- opposite strand)/Alignments examined > 75%, Forward-Reverse
- will be specified
- (3) If (first-in-pair opposite strand + second-in-pair same strand)/Alignments examined > 75%, Reverse-Forward will be specified
- (4) If neither of the percentages exceed 75%, No option will be used
- Forward - Reverse: this option is equivalent to the --fr-secondstrand option in Cufflinks [1]. First-in-pair is the same strand as the transcript, second-in-pair is the opposite strand to the transcript
...
- Reverse: this option is equivalent to --fr-firststrand option in Cufflinks. The single-end reads are the opposite strand to the transcript. The Illumina TruSeq Stranded library prep kit is an example of this configuration
| Numbered figure captions | ||||
|---|---|---|---|---|
| ||||
|
...
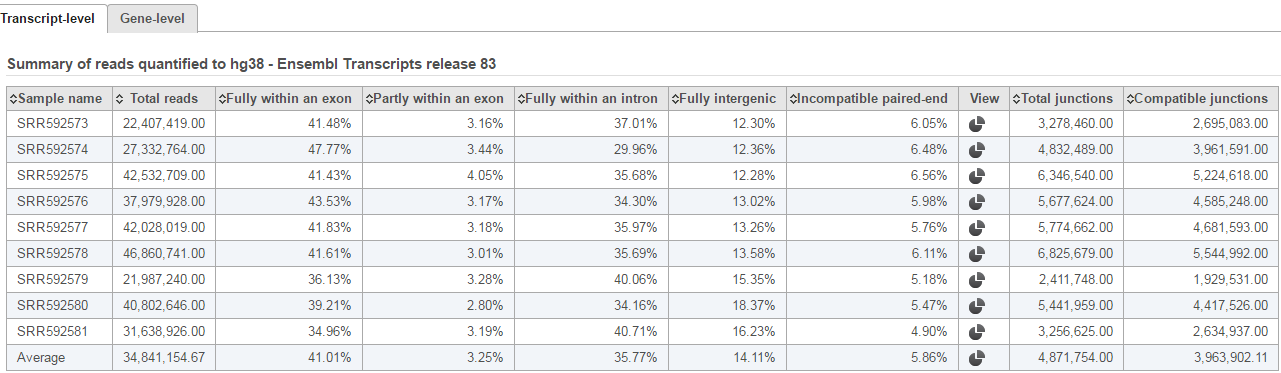
Depending on the annotation file, the output could be one or two data nodes. If the annotation file only contains one level of information, e.g. miRNA annotation file, you will only get one output data node. On the other hand, if the annotation file contains gene level and transcript level information, such as those from the Ensembl database, both gene and transcript level data nodes will be generated. If two nodes are generated, the Task report will also contain two tabs, reporting quantification results from each node. Each report has two tables. The first one is a summary table displaying the coverage information for each sample quantified against the specified transcriptome annotation (Figure 4).
| Numbered figure captions | ||||
|---|---|---|---|---|
| ||||
|
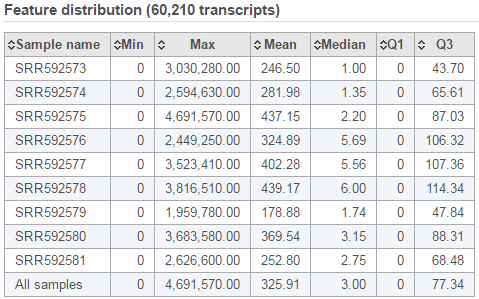
The second table contains feature distribution information on each sample and across all the samples, number of features in the annotation model is displayed on the table title (Figure 5).
| Numbered figure captions | ||||
|---|---|---|---|---|
| ||||
|
...
- Percentage of the features within the read count range
| Numbered figure captions | ||||
|---|---|---|---|---|
| ||||
|

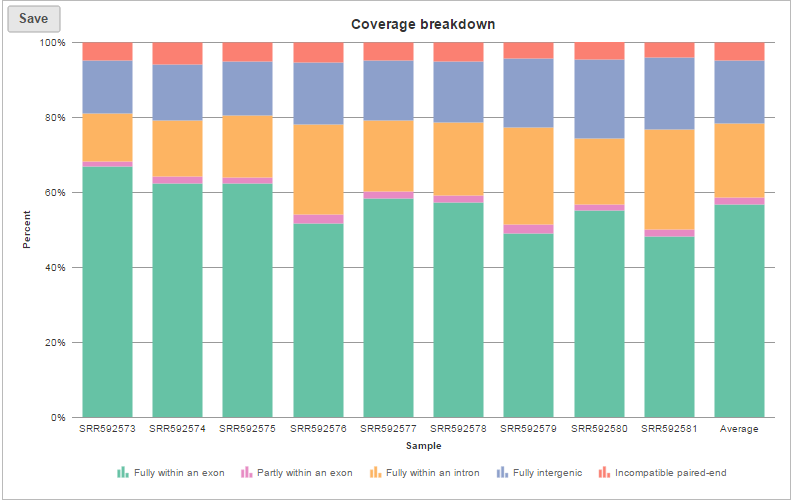
The coverage breakdown bar chart is a graphical representation of the reads summary table for each sample (Figure 7)
| Numbered figure captions | ||||
|---|---|---|---|---|
| ||||
|
...
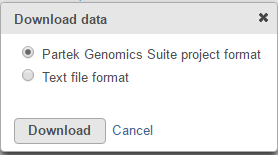
Text file format: it is a .txt file, you can open the text file in any text editor or Microsoft Excel, each row is a transcript, each column is a sample.
| Numbered figure captions | ||||
|---|---|---|---|---|
| ||||
|
References
- Xing Y, Yu T, Wu YN, Roy M, Kim J, Lee C. An expectation-maximization algorithm for probabilistic reconstructions of full-length isoforms from splice graphs. Nucleic Acids Res. 2006; 34(10):3150-60.
| Additional assistance |
|---|
| Rate Macro | ||
|---|---|---|
|
...
Overview
Content Tools