Page History
...
| Numbered figure captions | ||||
|---|---|---|---|---|
| ||||
|
B cells
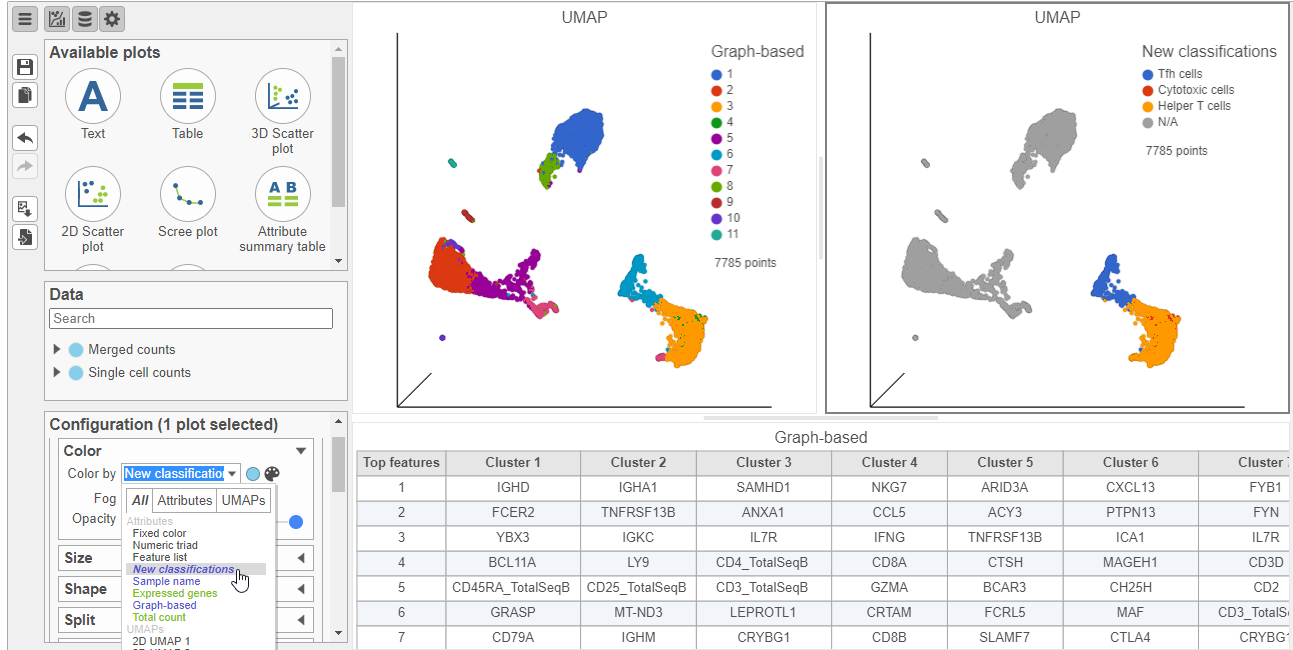
In addition to T-cells, we would expect to see B lymphocytes, at least some of which are malignant, in a MALT tumor sample. We can color the plot by expression of a B cell marker to locate these cells on the UMAP plot.
- In the Data card on the left, click Merged counts
- Scroll down and find the CD19_TotalSeqB protein marker
- Click the CD19_TotalSeqB marker and click and drag it over to the UMAP plot on the right
- Drop the CD19_TotalSeqB marker over the Color configuration option on the plot
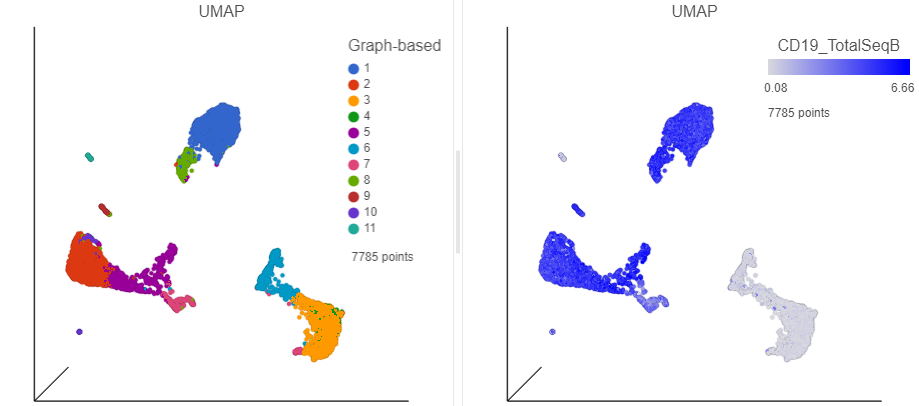
The cells in the UMAP plot are now colored from grey to blue according to their expression level for the CD19 protein marker (Figure ?). The CD19 positive cells correspond to several graph-based clusters. We can filter to these cells to examine them more closely,
...
| Numbered figure captions | ||||
|---|---|---|---|---|
| ||||
|
- Click
 in the top right corner of the UMAP plot
 - Lasso around the CD19 positive cells (Figure ?)
- Click
in the Filtering card on the right to include the selected points
| Numbered figure captions | ||||
|---|---|---|---|---|
| ||||
| Additional assistance |
|---|
| Rate Macro | ||
|---|---|---|
|
...
Overview
Content Tools