Join us for a webinar: The complexities of spatial multiomics unraveled
May 2
Page History
...
| Numbered figure captions | ||||
|---|---|---|---|---|
| ||||
|
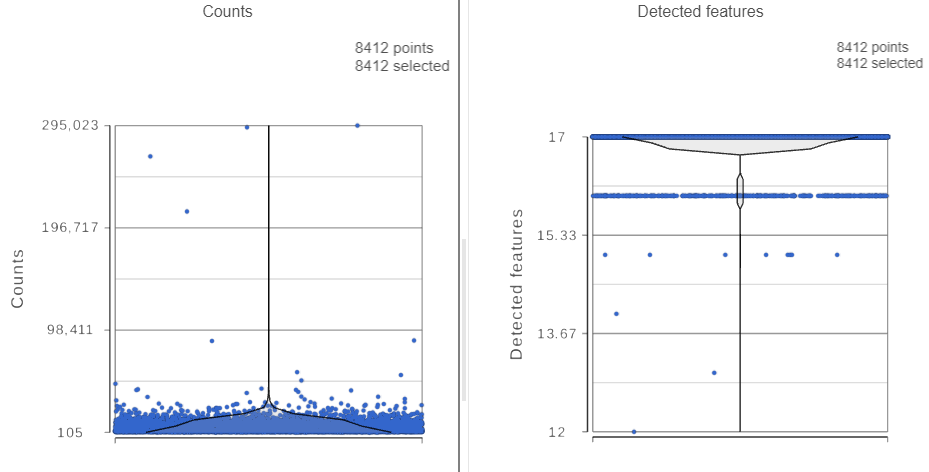
For this analysis, we will set a maximum counts threshold to exclude potential protein aggregates and, because we expect every cell to be bound by several antibodies, we will also set a minimum counts threshold.
...
Overview
Content Tools