Page History
...
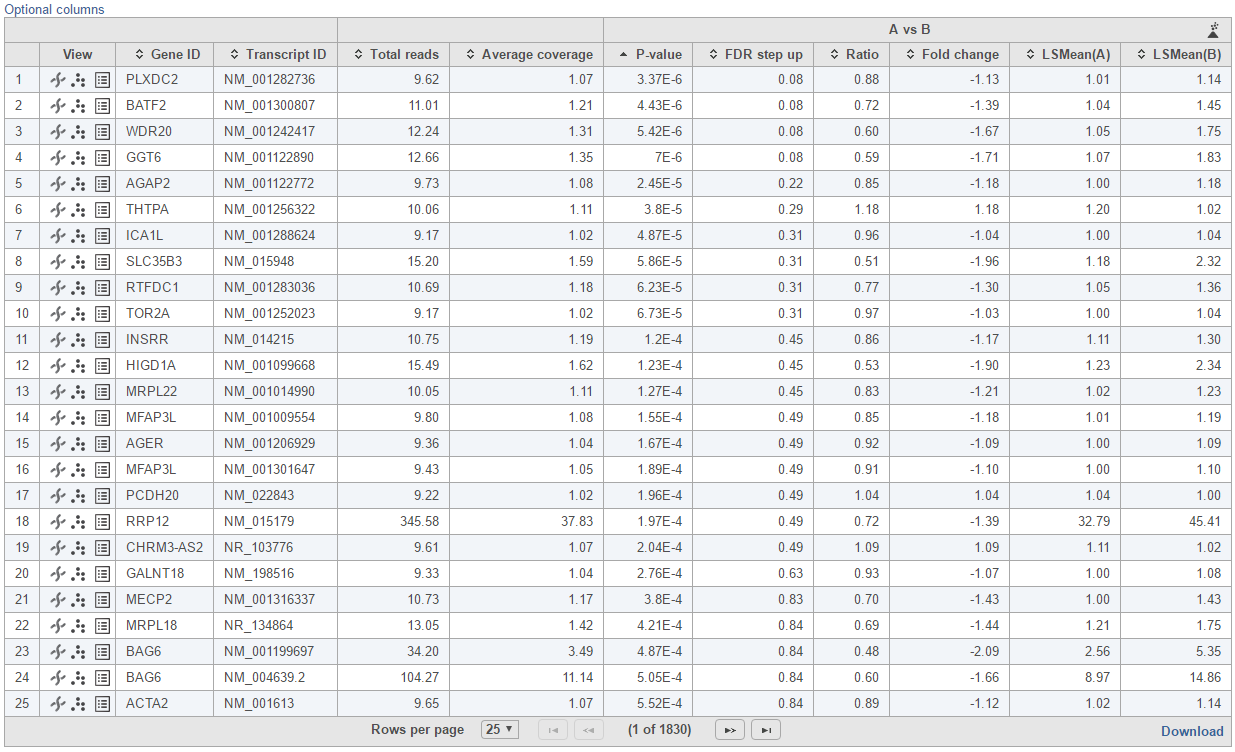
Feature list with p-value and fold change generated from the best model selected is displayed in a table with other statistical information (Figure 10). By default, the gene list table is sorted by the first p-value column.
| Numbered figure captions | ||||
|---|---|---|---|---|
| ||||
|
...
- Feature ID information: if transcript level analysis was performed, and the annotation file has both transcript and gene level information, both gene ID and transcript ID are displayed. Otherwise, the table shows only the available information.
- Total reads: total number of read across all the samples from the input data in linear space. If the input data is quantificatIon quantification output, then the total reads is the sum of reads of raw counts; if the input data is normalized, then the total reads is the sum of normalized reads; if the input data is logged, then the total reads is the sum of antilogged anti-logged value.
- Each contrast outputs p-value, FDR step up p-value, ratio and fold change in linear scale, LSmean of each group comparison in linear scale
By clicking on Optional columns, you can retrieve more statistics result information, e.g. Average coverage which is the geometric mean of normalized reads in linear scale across all the samples; fold change lower/upper limits generated from 95% confidence interval; feature annotation information if there are any more annotation information fields in the annotation model you specified for quantification, like genomic location, strand information etc.
...
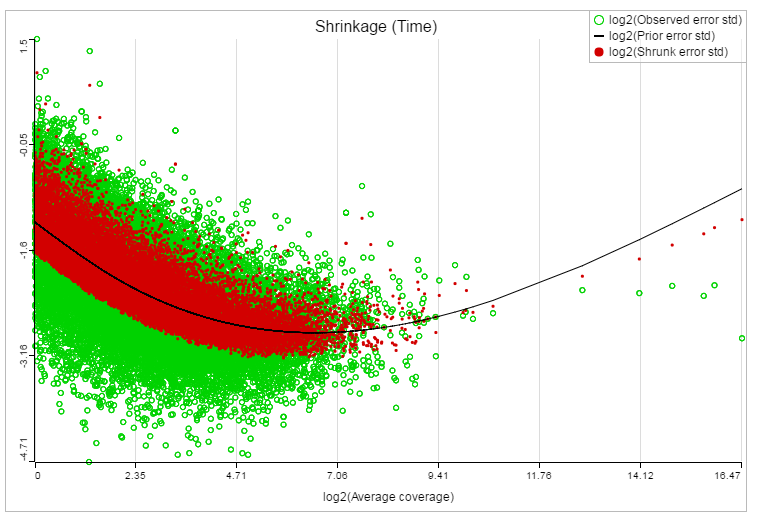
If lognormal with shrinkage method was selected for GSA, a shrinkage plot is generated in the report (Figure 13). X-axis shows the log2 value of average coverage. The plot helps to determine the threshold of low expression features. If there is an increase before a monotone decrease trend on the left side of the plot, you need to set a higher threshold on the low expression filter. Detailed information on how to set the threshold can be found in the GSA white paper.
| Numbered figure captions | ||||
|---|---|---|---|---|
| ||||
|
...
Overview
Content Tools