Page History
What is K-means clustering?
K-means clustering is a method a method for identifying groups of similar observations, i.e. cells or samples. K-means clustering aims to group observations into a pre-determined number of clusters (k) so that each observation belongs to the cluster with the nearest mean. An important limitation of K-means clustering is that it expects clusters to be of similar size (equal variance) and shape (distribution of variance is spherical).
Running K-means clustering
...
K-means clustering produces a Clustering result data node. The task report lists the cluster statistics and, if Compute cluster biomarkers was enabled, top marker features per cluster (Figure 2). If clustering was run with Split cells by sample enabled on a single cell counts data node, the cluster results table displays the number of clusters found for each sample and clicking the sample name opens the sample-level report.
...
| Numbered figure captions | ||||
|---|---|---|---|---|
| ||||
|
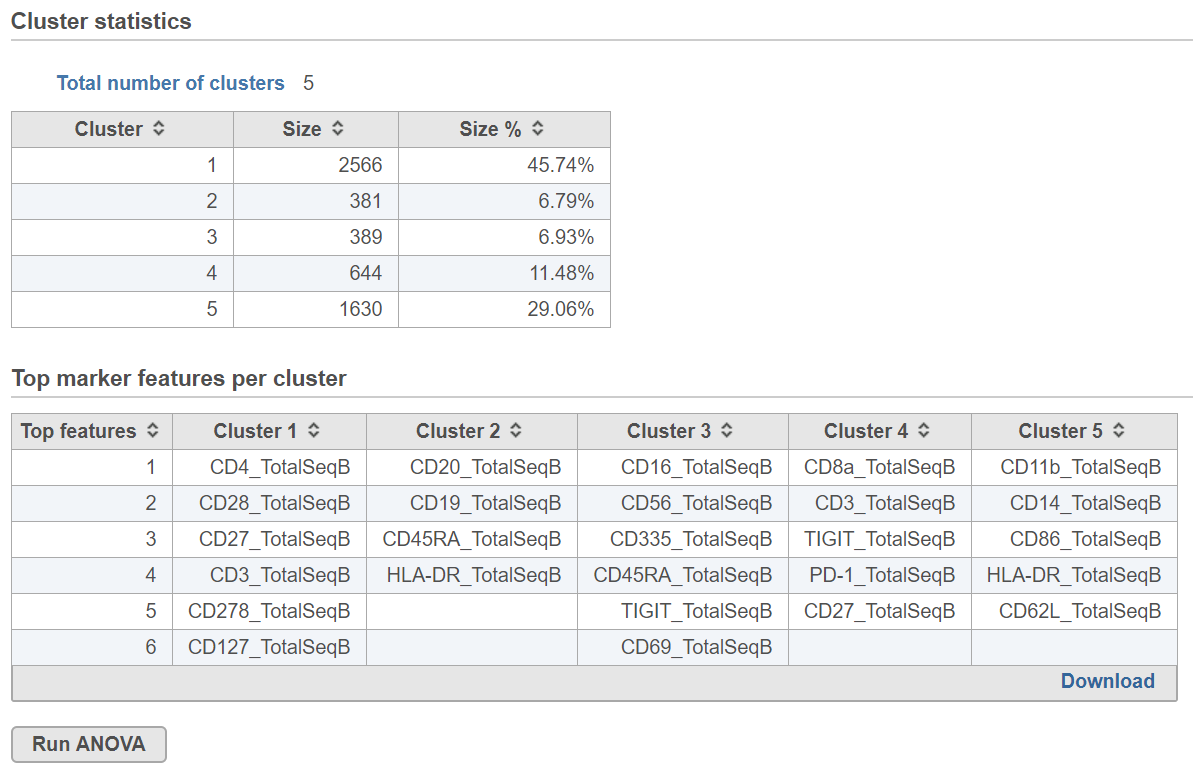
Cluster statistics
The total number of clusters is listed along with the number and percentage of cells in each cluster.
Top marker features per cluster
Biomarkers for each cluster are calculated using an ANVOA test where each cluster is compared to the other cells in the data set, genes with fold-change > 1.5 are included, and these genes are sorted by ascending p-value (ties broken by greater fold change). The top 10 genes for each cluster are shown in the table. The full ANOVA results can be obtained by clicking the Run ANOVA button, which will generate a Feature list data node.
Basic K-means clustering parameters
Distance metric
Choose which distance metric to use for cluster distance calculations. Options include Euclidean, Absolute Value, Euclidean Squared, Kendall Correlation, Max Value, Min Value, Pearson Correlation, Rank Correlation, Average Euclidean, Shape, Cosine, Canberra, Bray Curtis, Tanimoto, Pearson Correlation Absolute, Rank Correlation Absolute, and Kendall Correlation Absolute. The default is Euclidean.
...
Overview
Content Tools