Join us for a webinar: The complexities of spatial multiomics unraveled
May 2
Page History
...
| Numbered figure captions | ||||
|---|---|---|---|---|
| ||||
|
...
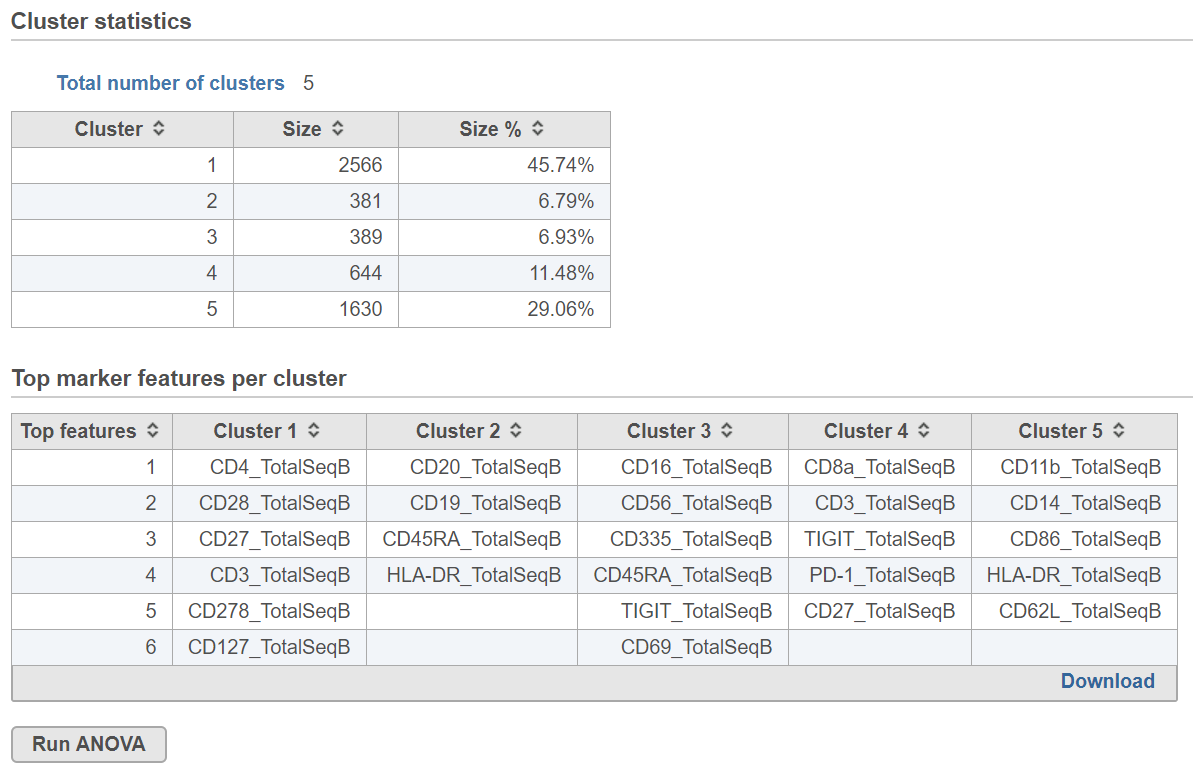
Biomarkers for each cluster are calculated using an ANVOA test where each cluster is compared to the other cells in the data set, genes with fold-change > 1.5 are included, and these genes are sorted by ascending p-value (ties broken by greater fold change). The top 10 genes for each cluster are shown in the table. The full gene list can be obtained as a text file by selecting the Download link. The full ANOVA results can be obtained by clicking the Run ANOVA button, which will generate a Feature list data node. Open the node to perform filtering based on p-value and/or fold-change or to invoke a volcano plot.
The Clustering result data node includes the input values for each gene and adds cluster assignment as a new attribute, K-means, for each observation. If the Clustering result data node is visualized by Scatter plot, PCA, t-SNE, or UMAP, the plot will be colored by the K-means attribute and the group biomarker table, if generated, will be included below the plot (Figure 3).
...
Overview
Content Tools